Foreign exchange history and the origins of Forex
The Foreign Exchange market, also referred to as the "Forex" or "FX" market, is the largest financial market in the world, with a daily average turnover of US$7.5trillion, larger than the combined volume of all U.S. equity markets at US$5.5 trillion.
"Foreign Exchange" is the simultaneous buying of one currency and selling of another.
Currencies are traded in pairs. For example:
Euro/US Dollar (EUR/USD)
or
US Dollar/Japanese Yen (USD/JPY).
There are two reasons to buy and sell currencies. About 5%of daily turnover is from companies and governments that buy or sell products and services in a foreign country or must convert profits made in foreign currencies into their domestic currency. The other 95% is trading for profit or speculation.
For speculators, the best trading opportunities are with the most commonly traded (and therefore most liquid) currencies, called "the Majors." Today, more than 85% of all daily transactions involve trading of the Majors, which include:
US Dollar
Japanese Yen
Euro
British Pound
Swiss Franc
Canadian Dollar
Australian Dollar
A true 24-hour market, Forex (FX) trading begins each day in Sydney and moves around the globe as the business day begins in each financial center, first to Tokyo, London, and New York. Unlike any other financial market, investors can respond to currency fluctuations caused by economic, social, and political events at the time they occur - day or night.
The Forex (FX) market is considered an Over the Counter (OTC) or 'interbank' market due to the fact that transactions are conducted between two counterparts over the telephone or via an electronic network. Trading is not centralized on an exchange, as with the stock and futures markets.
In order to gain a complete understanding of what Forex is, it is useful to examine the reasons that led to its existence in the first place. Exhaustively detailing the historical events that shaped the foreign exchange market into what it is today is of no great importance to the Forex trader, and therefore we happily will omit lengthy explanations of historical events such as the Bretton Woods accord in favor of a more specific insight into the reasoning behind foreign exchange as a medium of exchange of goods and services.
Originally, our ancestors conducted trading of goods with other goods. This system of bartering was, of course, quite inefficient and required lengthy negotiation and searching to be able to strike a deal. Eventually, forms of metal like bronze, silver, and gold came to be used in standardized sizes and later grades(purity) to facilitate the exchange of merchandise. The basis for these mediums of exchange was acceptance by the general public and practical variables like durability and storage. Eventually, during the late Middle Ages, a variety of paper IOUs started gaining popularity as an exchange medium.
The obvious advantage of carrying around 'precious' paper versus carrying around bags of precious metal was slowly recognized through the ages. Eventually stable governments adopted paper currency and backed the value of the paper with gold reserves. This came to be known as the gold standard. The Bretton Woods accord in July 1944 fixed the dollar to 35 USD per ounce of gold and other currencies to the dollar. In 1971, President Nixon suspended the convertibility to gold and let the US dollar 'float' against other currencies.
Since then, the foreign exchange market has developed into the largest market in the world with a total daily turnover of about 7.5 trillion USD. Traditionally an institutional (interbank)market, the popularity of online currency trading offered to the private individual is democratizing Forex and widening the retail market.
Forex market participants
In the last three decades, the foreign exchange market has expanded from one where banks would execute transactions between themselves to one in which many other kinds of financial institutions like brokers and market makers participate, including non-financial corporations, investment firms, pension funds, and hedge funds.
Its focus has broadened from servicing importers andexporters to handling the vast amounts of overseas investment and other capitalflows that currently take place. Lately, foreign exchange day trading has become increasingly popular, and various firms offertrading facilities to the small investor.
Foreign exchange is an 'over the counter' (OTC) market, which means that there is no central exchange or clearinghouse where orders are matched. Geographic trading 'centers' exist around the world, however, and are: (in order of importance) London, New York, Tokyo, Singapore, Frankfurt, Geneva & Zurich, Paris, and Hong Kong. Essentially, foreign exchange deals are made between participants on the basis of trust and reputation to deliver on an agreement. In the case of banks trading with one another, they do so solely on that basis. In the retail market, customers demand a written, legally accepted contract between themselves and their broker in exchange for a deposit of funds on which the customer may trade.
Some market participants may be involved in the 'goods' market, conducting international transactions for the purchase or sale of merchandise. Some may be engaged in 'direct investment' in plant and equipment, or may be in the 'money market,' trading short-term debt instruments internationally. The various investors, hedgers, and speculators may be focused on any time period, from a few minutes to several years. But, whether official or private, and whether their motive is investing, hedging, speculating, arbitraging, paying for imports, or seeking to influence the rate, they are all part of the aggregate demand for, and supply of the currencies involved, and they all play a role in determining the exchange rate at that moment.
New to Forex
When starting to trade on the Forex market, you have to be aware of this market's specificity. The Forex market allows a trader to make a profit when buying or selling. There is no commission per trade, but a spread between the buying and selling price. The below lines contain everything you should know about the Forex market.
What is Forex (Foreign Exchange, FX)?
Forex is the largest marketplace in the world, with more than 7 trillion dollars changing hands daily, making it one of the most attractive and lucrative markets.
These rates may be influenced by world economic and political events, currency rate differentials, and many other factors, including extreme weather conditions, acts of terror, etc.
Trading Platforms like Credit Societe offers online Forex trading services for traders wanting to make speculative transactions on the exchange rate between two currencies.
How does Forex work?
The Forex market allows you to buy and sell currencies against each other and speculate on the differences in exchange rates.
Making a transaction on the Forex Market is simple; the procedures are identical to those of any other markets so switching to trading currencies is straightforward for most traders.
Buying/Selling - B/S
If you want to open a position (i.e., place an order to sell—to make a profit if the exchange rate falls), you have to choose the amount (i.e.:100.000 EUR/USD) from the drop-down menu on the platform and then click the mouse on the sell or buy button.
This will open a position in the market, and you will receive an immediate notification of it on your trading station.
To close an open position, you have to do the opposite of the initial operation – in our case buy the 100.000 EUR/USD back.
Different order types also exist to open or close a position under a certain condition.
How does the Buy/Sell system work?
As with any market, for each currency pair, there are two prices. The difference between them is called the spread.
The spread is measured in points, or pips – lowest decimal figure in a currency rate.
For EUR/USD a pip equals 0.0001 (or 10 dollars on 100.000); for EUR/JPY a pip equals 0.01 (or 1000 yen on 100.000).
Forex currency quotation system
Currencies are quoted in pairs, for example – EUR/USD or USD/JPY.
The first currency in the pair is called the base currency, and the second is called the counter currency.
The base currency is the ‘basis' for purchases and sales.
For example, if you buy EUR/USD, then you acquire Euros and sell Dollars. You do this if you expect the Euro to grow against the Dollar.
It is also possible for a currency pair to be quoted as USD/EUR, but this method is used extremely rarely.
Each transaction must have 2 sides: a buy and a sell (or a sell and a buy).
By this, we mean that it is impossible to buy 100.000EUR/USD and then exchange it for another currency pair (i.e., EUR/JPY) without closing the first position.
Please note that no physical currency delivery will be made. For these purposes, banks and exchange companies that specialize in low-rate currency conversions are available.
Forex market working hours
The Forex Market, based on ‘spot' transactions, is unique in comparison with all other global markets.
This is because trading takes place 24 hours a day, 5 days a week (Credit Societe platform works from Monday 00:00 to Friday 23:00 CET). Financial centers are open for work, and banks and other organizations exchange currencies in different parts of the world for different purposes.
If the funds in the account, in the course of trading, fall below the prescribed margin, your positions will be closed automatically without prior notice. Using this system, the client's account cannot go overdrawn even under volatile, fast-changing market conditions.
The formula for calculating margins is as follows: (account balance + profit/loss): open position = the margin
Rollover of positions (swap)
For the sake of transparency, and unlike any other online broker, we have a complete explanation of the applied cost of carrying on behalf of the market or the customer on open positions held overnight. This overnight cost of carry is presented as a simple flat fee, either paid or charged to a customer's account. This process makes for extremely simple statements and greatly increases executional transparency since we do not modify the original price of the position entered by the customer.
How do I start trading forex?
Open a live account if you feel ready to trade in the real market
OR
Open a demo account on our trading platforms and choose which suits you best
Define how long you can trade for.
Define the currency pair you feel most comfortable with.
Choose the tradable amount.
Before opening a position, you have to consider how much profit you wish to make or how much loss you are eventually prepared to take. Depending on this analysis, place stop and/or limit orders.
Open your position or place an entry order.
Follow significant news events and technical indicators, which you can consult inside your trading station or from third-party sources.
Forex trading strategy
Trading successfully is by no means a simple matter. It requires time, market knowledge, market understanding, trading strategy, and a large amount of self-restraint. Credit Societe does not manage accounts, nor does it give market advice; that is the job of money managers and introducing brokers. As market professionals, we can, however, point the novice in the right direction and indicate what are the correct trading tactics and considerations and what is total nonsense.
Anyone who says you can consistently make money in foreign exchange markets is being untruthful. Foreign exchange, by nature, is a volatile market. The practice of online currency trading by way of margin increases that volatility exponentially. We are therefore talking about a very 'fast market,' which is naturally inconsistent. Following that precept, it is logical to say that in order to make a successful trade, a trader has to take into account technical and fundamental data and make an informed decision based on his perception of market sentiment and market expectation. Timing a trade correctly is probably the most important variable in trading successfully, but invariably there will be times when a trader’s timing will be off. Don't expect to generate returns on every trade.
Let's enumerate what a trader needs to do in order to put the best chances for profitable trades on their side:
Trade with money you can afford to lose:
Trading FX markets is speculative and can result in losses; it is also exciting, exhilarating and, can be addictive. The more you are 'involved with your money,’ the harder it is to make a clear-headed decision. Money you have earned is precious, but money you need to survive should never be traded.
Identify the state of the market:
What is the market doing? Is it trending upwards or downwards? Is it in a trading range? Is the trend strong or weak? Did it begin long ago, or does it look like a new trend is forming?
Getting a clear picture of the market situation lays the groundwork for a successful trade.
Determine what time frame you're trading on:
Many traders get into the market without thinking about when they would like to get out; after all, the goal is to make money. This is true, but when trading, one must extrapolate in his mind's eye the movement that one expects to happen. Within this extrapolation, there is a price evolution over a certain period. Attached to this is the idea of an exit price. The importance of this is to mentally put your trade in perspective, and although it is clearly impossible to know exactly when you will exit the market, it is important to define from the outset if you'll be 'scalping' (trying to get a few points off the market), trading intra-day, or going longer term. This will also determine what chart period you're looking at. If you trade many times a day, there's no point basing your technical analysis on a daily graph; you'll probably want to analyze the 30-minute or hourly graphs. Additionally, it is important to know the different time periods when various financial centers enter and exit the market, as this creates volatility and liquidity and can influence market movements.
Time your trade:
You can be right about a potential market movement but be too early or too late when you enter the trade. Timing considerations are twofold, an expected market figure like CPI, retail sales, or a federal reserve decision can consolidate a movement that's already underway. Timing your move means knowing what's expected and taking into account all considerations before trading. Technical analysis can help you identify when and at what price a move may occur. We will look at technical analysis in more detail later.
If in doubt, stay out:
If you're unsure about a trade and find you're hesitating, stay on the sidelines.
Trade logical transaction sizes:
Margin trading allows the FX trader a very large amount of leverage, trading at full margin capacity (in Credit Societe's case 0.8%) can make for some very large profits or losses on an account. Scaling your trades so that you may re-enter the market or make transactions on other currencies is generally wiser. In short, don't trade amounts that can potentially wipe you out and don't put all your eggs in one basket. Credit Societe offers the same rates regardless of transaction sizes, so a customer has nothing to lose by starting small.
Gauge market sentiment:
Market sentiment is what most of the market is perceived to be feeling about the market and therefore what it is doing or will do. This is basically about trends. You may have heard the term 'the trend is your friend.' This basically means that if you're in the right direction of the trend you will make successful trades. This, of course, is very simplistic. A trend is capable of reversal at any time. Technical and fundamental data can indicate, however, if the trend has begun long ago and if it is strong or weak.
Market expectation:
Market expectation relates to what most people are expecting as far as upcoming news is concerned. If people are expecting an interest rate to rise and it does, then there usually will not be much of a movement because the information will already have been 'discounted' by the market; alternatively, if the adverse happens, markets will usually react violently.
Use what other traders use:
In a perfect world, every trader would be looking at a 14-day RSI and making trading decisions based on that. If that were the case, when RSI would go below the 30 level, everyone would buy, and by consequence, the price would rise. Needless to say, the world is not perfect, and not all market participants follow the same technical indicators, draw the same trendlines, and identify the same support and resistance levels. The great diversity of opinions and techniques used translates directly into price diversity. Traders, however, have a tendency to use a limited variety of technical tools. The most common are 9- and 14-day RSI, obvious trendlines and support levels, Fibonacci retracement, MACD, and 9-, 20- and 40-day exponential moving averages. The closer you get to what most traders are looking for, the more precise your estimations will be. The reason for this is simple arithmetic: larger numbers of buyers than sellers at a certain price will move the market up from that price, and vice versa.
Market Order
All order types listed underneath are accepted by Credit Societe and may be placed online. A market order is an order to buy or sell at the current market price. Customers using Credit Societe's online currency trading platform click on the buy or sell button after having specified their deal size. The execution of the order is instantaneous, which means that the price seen at the exact time of the click will be given to the customer.
Whether you choose to deal with Credit Societe or another firm, you should be aware that it is correct market practice for such institutions to quote two-way prices to a customer who wishes to trade. A firm that does not do so is almost certainly taking advantage of their customers' ignorance as far as trading procedures are concerned.
Limit Orders
A limit order is an order placed to buy or sell at a certain price. The order essentially contains two variables: price and duration. The trader specifies the price at which the wishes to buy or sell a certain currency pair and also specifies the duration for which the order should remain active.
GTC (Good till cancelled)
A GTC order remains active in the market until the trader decides to cancel it. The dealer will not cancel the order at any time; therefore, it is the customer's responsibility to remember that the possesses the order.
GFD (Good for the day)
A GFD order remains active in the market until the end of the trading day. Since foreign exchange is an ongoing market, the end of the day must be a set hour.
For some the end of the trading day occurs at exactly 12:00 GMT or 16:00 SST.
Stop orders
A stop order is also an order placed to buy or sell at a certain price. The order contains the same two variables: price and duration. The main difference between a limit order and a stop order is that stop orders are usually used to limit loss potential on a transaction, whereas limit orders are used to enter the market, add to a preexisting position, and profit taking. The same variations are used to specify duration as in limit orders (GTC and GFD).
Let's take the following example:
Trader x buys EUR/USD 100'000 @ 0.9340, they’re expecting a 60 to 70pip move in the market, but they want to protect themselves in case they have overestimated the potential strength of the Euro. They know that 0.9310 is a support level, so the place a stop-loss order to sell at that level. Trader x has limited their risk on this particular trade to 30 pips or USD 300.
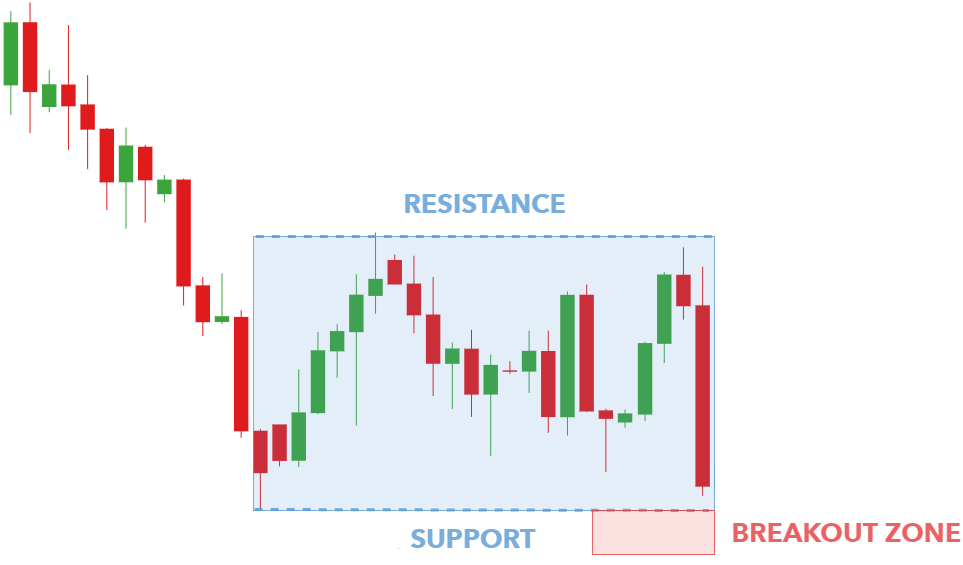
Another usage of a stop order is when a trader is expecting a price breakout to occur and wishes to grasp the opportunity to 'ride' the breakout. In this case, a trader will place an order to buy or sell 'on stop'.
To illustrate the logic behind this, let's review the following scenario:
Trader x sees EUR/USD breaking through the 0.9390 resistance level.
They believe that if this happens, the price of EUR/USD could be headed to 0.9450 or higher.
At this point, the market is at 0.9350, so trader x places an order to initiate a buying position of 500'000 at 0.9392 'on stop'.
OCO
An OCO (order cancels other) order is a mixture of two limit and/or stop orders. Two orders with price and duration variables are placed above and below the current price. When one of the orders is executed, the other order is cancelled.
To illustrate how an OCO order works let's take the following example:
The price of EUR/USD is 0.9340.
Trader x wants to either buy500'000 at 0.9395 over the resistance level in anticipation of a breakout or initiate a selling position if the price falls to 0.9300.
The understanding is that if0.9395 is reached, he will buy 500'000 and the 0.9300 order will be automatically cancelled.
Forex trading example
Trader X has an account of USD 50,000. He buys EUR/USD 500,000 at 1.1500 at the market and places a stop-loss order at 1.1460.
At this point his maximum risk is USD 2,000 and his margin utilization is 10%, well above the minimum.
During the day, the Forex market fluctuates and initially moves down to 1.1480.
At this point trader X has an unrealized loss of USD 1,000 and his margin utilization has fallen to 9.60%, reflecting the effect of the downward move on his margin capacity.
Later still, the price moves back up to 1.1550 and trader x decides to take profit. He sells at 1.1550, making a USD 2,500 profit, which represents a 5% return on his account value. Note that trader X took only a risk of USD 2,000 and made a return of USD2,500. This equates to a risk/reward ratio of 1.25. A high risk/reward ratio is what every trader should be aiming for.
The reader should note that the example above is a random-case scenario and is in no way meant to imply that the potential for profit is greater than the potential for loss in foreign exchange trading.
Familiarize yourself with Forex trading with our free Forex demo account.
Forex Trading
Compared to other financial markets, the Forex market offers many advantages, such as 24h trading, no commissions, and margin trading. Most of the advantages Forex trading offers are listed below.
Advantages of Forex Trading
The Forex market is by far the largest and most liquid in the world. Credit Societe offers online Forex trading services to the small investor with minimum account opening values starting at 10,000 USD. There are many advantages to trading spot foreign exchange as opposed to stocks and futures. Below are listed those main advantages.
1. Bid/Ask Spread Rates
Spread rates have tightened dramatically since 2022. Most online Forex brokers offer a spread of 2 pips on EURUSD which is the most widely traded and liquid currency pair. Credit Societe offers a 1 pip spread on EURUSD. In stock trading, only liquid stocks offer tight spreads. Those spreads often represent, on average, between 0.01% and 0.02% of the value of the stock. In comparison, Credit Societe offers a 0.8 pip spread on all major currencies; this equates to approximately between 0.01% and 0.02% on the underlying dollar value.
Exact percentages at current rates (Jan 2008):
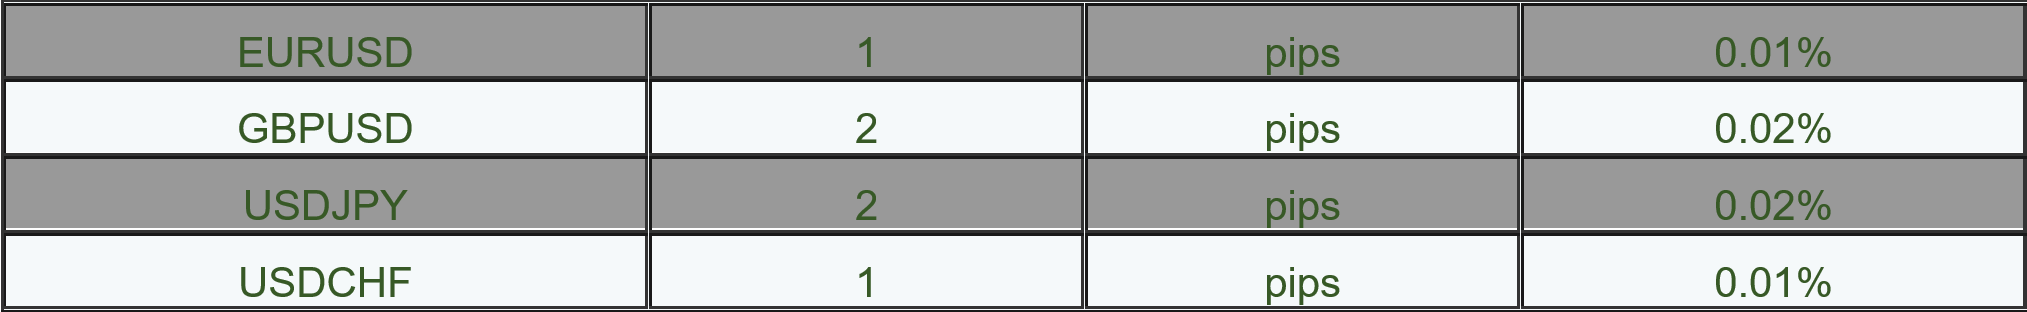
In the futures market. spreads can vary anywhere between 1 and 3 pips and can become even larger under illiquid market conditions (which tend to happen substantially more often in futures currencies).
2. Forex Trading Commissions
Credit Societe offers Forex trading commission-free. This is in sharp contrast to (once again) what stock and futures brokers offer. A stock trade can cost anywhere between USD 5 and USD 30 per trade with online brokers and typically up to USD 150 with full-service brokers. Futures brokers can charge commissions anywhere between USD 10 and USD 30 on a round-trip basis.
3. Forex Trading Margins Requirements
Credit Societe offers Forex trading with a 1% margin. In layman's terms, that means a trader can control a position with a value of USD 1,000,000 with a mere USD 10,000 in their account. By comparison, futures margins are not only constantly changing but are also often quite sizeable. Stocks are generally traded on a non-margined basis, and when they are, it can be as restrictive as 50% or so.
4. 24-Hour Forex Trading
Forex trading market occurs over a 24-hour period picking up in Asia around 05:00 SST and coming to an end on Saturday around 05:00 SST. Although ECNs (electronic communications networks) exist for stock markets and futures markets (like Globex) that supply after-hours trading, liquidity is often low, and prices offered can often be uncompetitive.
5. No Limit Up/Limit Down
Futures markets contain certain constraints that limit the number and type of transactions a trader can make under certain price conditions. When the price of a certain currency rises or falls beyond a certain predetermined daily level traders are restricted from initiating new positions and are limited only to liquidating existing positions if they so desire.
This mechanism is meant to control daily price volatility, but in effect, since the futures currency market follows the spot market anyway, the following day the futures market may undergo what is called a 'gap', or in other words, the futures price will re-adjust to the spot price the next day. In the OTC market, no such trading constraint sexist, permitting the trader to truly implement their trading strategy to the fullest extent. Since a trader can protect their position from large, unexpected price movements with stop-loss orders, the high volatility in the spot market can be fully controlled.
6. Sell Before You Buy
Equity brokers offer very restrictive short-selling margin requirements to their customers. This means that a customer does not possess the liquidity to be able to sell stock before they buy it. Margin-wise, a trader has exactly the same capacity when initiating a selling or buying position in the spot market. In spot trading, when you're selling one currency, you're necessarily buying another.
Advantages of foreign exchange trading with Credit Societe
By opening a live foreign exchange trading account of Credit Societe, you can enjoy the following advantages:
Spreads as low as 1 pip.
Index trading.
Futures spot trading.
Spot trading of precious metals.
No negative balances, limiting risk.
Execution in real time with no confirmation delay.
Prompt and rigorous customer service.
Managed by market professionals.
Guaranteed execution of limit and stop orders.
Real-time market reports from the back office.1% margin trading or 100:1 leverage.
The world's most clicked foreign exchange dealer.
Complete technical analysis and real-time charting tools.
50 tradable currency pairs with one click.
Log in to the trading platform at will without interference from firewalls.
Friendly platform operation, account overview is completely transparent.
The operation process of the demonstration and the real trading platform is the same.
Three online trading platforms for maximum flexibility.
Complete real-time news receiving system, streaming real-time market news.
Fully safe and powerful online trading platform: 128-bit SSL encryption technology.
24-hour online currency trading services from Sunday to Friday.
Multiple denomination accounts: USD, EUR, GBP, CHF, CAD, AUD or JPY.
A simple trading platform that does not need to be downloaded, you can trade anytime, anywhere at home, in the office or in an Internet cafe.
Property rights transaction software, without renting or buying, provides customers with the most competitive price and execution power.
What you click is what you get. The price you click is the price at which the transaction takes place, i.e., there is no slippage.
Without using the request for quotation mechanism, the user clicks on the real-time streaming price trend, and the real-time market changes rapidly. Credit Societe will not re-quote the quoted price, and there will beno trader intervention.
Maintain consistent liquidity in all market conditions. Credit Societe cooperates with the world's top institutional liquidity providers to provide more than 50% of the world's foreign exchange liquidity on our platform.
Complete real-time account management and reporting system, margin analysis, profit and loss, transaction confirmation, market analysis and low transaction fee rate, Credit Societe customers can obtain corresponding benefits from the technical and basic foreign exchange reports provided by our branches.
When trading at Credit Societe, all your risks come only from funds or deposits. Our unique automated margin liquidation policy eliminates traders' concerns about incurring liabilities, and we guarantee that your liabilities will never exceed the amount in your account.
How to trade Forex?
The Foreign Exchange market, which is often referred to as "Forex" or "FX markets," is the largest, most liquid, and most transparent financial market in the world. The daily average turnover has now exceeded 7 trillion USD. All the U.S. equity markets combined do not reach3% of the total volume traded on the FX market.
Unlike other financial markets, where for the most part you can only profit in rising markets, in the FX market whenever one enters into a position, they are long (buys) one currency and short (sells) another currency simultaneously, which means that, as opposed to other cyclical financial markets, in the FX markets there are endless opportunities.
Placing an order is as simple as that: choose the currency pair, the amount of the base currency you want to trade, and if you want to buy or sell, when trading with an online platform, just click and there you are.
But though it sounds very easy, the Forex market has its own rules, uses, and usual practices.
In order to trade properly, the following will provide you with important guidelines and tips.
What types of order will you have to place under specific market conditions?
Examples of a typical trading day (very simplified) to give you an idea of how it works.
But moreover, when taking a position on the market, your exposure has to be consistent with your feeling of the market sentiment, the trading time frame you defined, and your financial capacities. That's what we call trading Forex with a strategy.
Currency Pairs
Each currency is recognized by a three-letter code.
For example, EUR is the Euro and refers to the European currency, USD is the United States Dollar.
The world’s leading currencies (often referred to as the majors) are the EUR (Euro), USD (US Dollar), JPY (Japanese Yen), GBP (the British Pound or Sterling), CHF (the Swiss franc), AUD (the Australian Dollar) and CAD (the Canadian Dollar).
Currencies are traded in pairs and are displayed as such. There is always the three-letter currency code, an optional slash, and another three-letter currency code. The first currency displayed refers to the "base", "leading" or "primary currency"; the second currency refers to the "secondary currency".
For instance, when looking at the EUR/USD, the EUR is the leading currency, and the USD is the secondary currency. The "currency pair" or "currency cross" is then followed by a number; this is typically a five-digit number with a decimal point after the first, for instance, 1.0660.
The number represents the ratio of one currency against the other and can be read as "the amount of the secondary currency needed in order to have one unit of the major currency". In the example just given, EUR/USD 1.0660, one would require 1 Dollar and 6.6 cents to exchange for 1 Euro.
What is a currency pair?
In the foreign exchange market, currencies are traded in pairs. The two constituent currencies of a currency pair are related and inseparable.
The two constituent currencies of a currency pair are exchanged for each other in a transaction. The price at which they are exchanged is called the exchange rate. Exchange rates are affected by the supply and demand of currencies.
The most common currency:
The most commonly traded currencies in the market are called "major currencies".
Most currencies are bought and sold against the U.S. dollar (USD).
The US dollar (USD) is the most traded currency.
The next five most frequently traded currencies are:
Euro (EUR)
Japanese Yen (JPY)
British Pound (GDP)
Swiss Franc (CHF)
Australian dollar (AUD)
The transactions between these six major currencies account for 90% of the global foreign exchange market.
The most common currency pair is the euro/dollar (EUR/USD).
Exchange rate:
Exchange rates change rapidly. Supply and demand in the market determine the value of a currency, and the value of one currency in the foreign exchange market is represented by another currency. In a currency pair, the first currency is called the "base currency" and the second currency is called the "quote currency" or "relative currency".
When you trade currencies, you buy the base currency and sell the quote currency. The exchange rate tells buyers how much the quoted currency costs to buy one unit of the base currency.
The order of currency pairs is usually unchanged, which is a common practice in the industry. For example: USD/JPY (USD is the base currency and JPY is the quote currency).
The order in which you see currency pairs does not change. So, whether you buy or sell depends on the direction of the trade. Example: USD/JPY (You can buy JPY with USD or buy USD with JPY.)
You can check the order of each tradable currency in the currency pair on the website of Credit Societe.
For example: EUR/USD 1.2500 means you need 1.25 USD to buy 1 Euro. It can also be said that if you sell 1 euro, you will get 1.25 dollars. All transactions involve simultaneously buying one currency and selling another. If, on the next day, the euro appreciates against the U.S. dollar and the exchange rate becomes 1.26, you will earn 1 cent for every euro you originally bought. If you trade in the opposite direction, you will lose 1 cent for every euro you sold (sold at 1.25) (because1 euro at this time requires you to take 1.26 dollars to "buy back").
Currency trading:
In the foreign exchange market, traders make money by buying and selling currencies. A currency has two prices: a bid, called the "bid" and a sell, called the "ask". The difference between the asking price and the bid price is the "spread". It represents the difference between buying and selling by a market maker and a dealer.
Example: Bid/Ask for EUR/USD is 1.2100/1.2200.
A market maker buys 1 euro from a dealer for $1.21 but sells that euro to the dealer for $1.22. If traders buy and sell quickly when there is no change in the exchange rate, they will suffer losses. This is caused by spreads, because traders buy more than they sell. In fact, spreads are the main source of income for market makers. As in any other marketplace, merchants charge more to sell than to buy.
No slippage in market orders:
At Credit Societe you will not receive orders placed at prices other than bid/ask quotes. More importantly, we will treat the order equally whether it is 1,000, 10,000 or even 10 million.
Even a small difference in pips can eat up your trading profits. At Credit Societe, you have direct access to the real-time rolling quotes we provide, and the price you see is the price you can get.
Quotation:
A "quote" is the price of a currency.
There are two forms of quotation in the foreign exchange market: direct quotation and indirect quotation. A direct quote is the price per dollar expressed in other currencies. An indirect quote is the price per unit of another currency expressed in dollars.
Please note: In general, most currencies are quoted relative to the USD (e.g., "direct quote"). But EUR, GBP, AUD, NZD, and gold (XAU) and silver (XAG) all use indirect quotations, for example: GBP/USD.
A quote is the price at which a currency pair is traded. Itis different from "reference quotation", which is information provided by market makers for reference only (for traders to understand, not the real execution price). Credit Societe provides real-time quotes for logged-in users. Delayed quotes (i.e., "reference prices") are offered to other users.
Want to get real-time quotes for foreign exchange? Please join the Credit Societe trading platform for free.
What is Forex fundamental analysis?
The Forex fundamental analyst identifies and measures factors that determine the intrinsic value of a financial instrument, such as the general economic and political environment, including any that affect supply and demand for the underlying product or service. If there is a decrease in supply but the level of demand remains the same, then there will be an increase in market prices. An increase in supply produces the opposite effect.
For example, an analyst for a given currency studies the supply and demand for the country's currency, its products or services (Merchandise Trade), its management quality and government policies; its historic and forecasted performance; its future plans, and, most importantly for the shorter term, all the economic indicators.
From this data, the analyst constructs a model to determine the current and forecasted value of a currency against another. The basic idea is that unmatched increases in supply tend to depress the currency value, while unmatched increases in demand tend to increase the currency value. Once the analyst estimates the intrinsic value, they will compare it to the current exchange rate and decides whether the currency ought to rise or fall.
One difficulty with fundamental analysis is accurately measuring the relationships among the variables. Necessarily, the analyst must make estimates based on experience. In addition, the Forex markets tend to anticipate events and discount their currency value in advance. Finally, serving as both a disadvantage and even an advantage (depending upon the timing), the markets often take time to recognize that exchange rates are out of line with value.
Introduction to Fundamental Analysis
Fundamental analysis refers to the study of the core underlying elements that influence the economy of a particular entity. It is a method of study that attempts to predict price action and market trends by analyzing economic indicators, government policies, and societal factors (to name just few elements) within a business cycle framework. If you think of the financial markets as a big clock, the fundamentals are the gears and springs that move the hands around the face. Anyone walking down the street can look at this clock and tell you what time it is now, but the fundamentalist can tell you how it came to be this time and more importantly, what time (or more precisely, what price) it will be in the future.
There is a tendency to pigeonhole traders into two distinct schools of market analysis: fundamental and technical. Indeed, the first question posed to you after you tell someone that you are a trader is generally, "Are you a technician or a fundamentalist?" The reality is that it has become increasingly difficult to be a purist of either persuasion. Fundamentalists need to keep an eye on the various signals derived from the price action on charts, while few technicians can afford to completely ignore impending economic data, critical political decisions, or the myriad of societal issues that influence prices.
Bearing in mind that the financial underpinnings of any country, trading bloc, or multinational industry take into account many factors, including social, political, and economic influences, staying on top of an extremely fluid fundamental picture can be challenging. At the same time, you'll find that your knowledge and understanding of a dynamic global market will increase immeasurably as you delve further and further into the complexities and subtleties of the fundamentals of the markets.
Fundamental analysis is a very effective way to forecast economic conditions, but not necessarily exact market prices.
For example, when analyzing an economist's forecast of the upcoming GDP or employment report, you begin to get a fairly clear picture of the general health of the economy and the forces at work behind it. However, you'll need to come up with a precise method as to how best to translate this information into entry and exit points for a particular trading strategy.
A trader who studies the markets using fundamental analysis will generally create models to formulate a trading strategy.
These models typically utilize a host of empirical data and attempt to forecast market behavior and estimate future values or prices by using past values of core economic indicators. This information is then used to derive specific trades that best exploit this information.
Don't succumb to 'paralysis by analysis.'
Given the multitude of factors that fall under "The Fundamentals," there is a distinct danger of information overload. Sometimes traders fall into this trap and are unable to pull the trigger on a trade. This is one of the reasons why many traders turn to technical analysis. To some, technical analysis is seen as a way to transform all of the fundamental factors that influence the markets into one simple tool: prices. However, trading a particular market without knowing a great deal about the exact nature of its underlying elements is like fishing without bait. You might get lucky and snare a few on occasion, but it's not the best approach over the long haul.
For Forex traders, the fundamentals are everything that makes a country tick.
From interest rates and central bank policy to natural disasters, the fundamentals are a dynamic mix of distinct plans, erratic behaviors and unforeseen events. Therefore, it is better to get a handle on the most influential contributors to this diverse mix than to formulate a comprehensive list of all "The Fundamentals."
Market analysis tools
As a foreign exchange dealer, Credit Societe is only responsible for executing transactions. We do not provide our own analysis services to clients, but we cooperate with many professional companies in fundamental analysis and technical analysis. The following pages contain information on technical and fundamental analysis of financial markets, but we do not provide market positioning opinions. To view the latest fundamental and technical market analysis provided by Credit Societe partners, please visit the foreign exchange analysis page.
Credit Societe is one of the most competitive foreign exchange brokers in the world. To understand the reasons, you can browse the execution method. You can also visit the Advantages of Trading the Forex Market for a list of the advantages Credit Societe offers.
Forex basic analysis
What is Forex Fundamental Analysis?
Fundamental foreign exchange analysts identify and measure the factors that determine the intrinsic value of a financial instrument, such as the general economy and political environment, as well as factors that affect product or service relationships. If the supply falls but the level of demand remains the same, then the market price will rise. An increase in supply has the opposite effect.
Analysts of a particular currency study all economic indicators: the country's currency, product or service (commodity trading) supply and demand; quality of management and government policies; historical performance and forecasted future performance; future plans and, most importantly, short-term plans. From the data, the analyst determines the analytical pattern of the current and future expected value of one currency compared to another. The basic meaning is that mismatched growth with supply will lead to currency depreciation, and mismatched growth with demand will lead to currency appreciation.
After assessing the intrinsic value, the analyst compares this data with the current exchange rate to determine whether the currency should depreciate or appreciate.
One of the difficulties in technical analysis is measuring the relationship between different variables. The analyst's assessment must be based on experience. In addition, the foreign exchange market needs to anticipate upcoming events and reduce their impact in advance. Ultimately, as a market with pros and cons (depending on the timing), the market always needs time to digest and think about whether the exchange rate deviates from the actual value.
Forex technology
Forex Technical and Forex Fundamental Analysis
Forex Technical Analysis: A method of predicting market prices and future development trends by studying past market conditions, including financial instrument prices, trading volumes, and financial instrument exposure equity.
Forex basic analysis: A method of predicting the future price development trend of financial instruments based on factors such as economic, political, environmental, and other relevant factors and data that affect the basic supply and demand of financial instruments.
Many traders usually use a combination of technical analysis and fundamental analysis to determine their foreign exchange trading strategies. A major advantage of technical analysis is that experienced analysts can refer to a number of markets and market tools for analysis, while fundamental analysis requires understanding of a specific market pattern.
The main differences between the two analysis methods are as follows:
Fundamental analysis
Pay attention to the upcoming changes in the market. Factors Involved in Price Analysis:
1. Supply and demand
2. Seasonal cycle
3. Weather
4. Government policy
Technical analysis
Pay attention to the changes that have occurred in the market. Charts are based on market behaviors, including:
1. Price
2. Sales
3. Exposure equity (applicable to futures only)
Fundamental analysis studies the causes of market changes, while technical analysis studies the effects of market changes.
Forex technical analysis
What is Forex Technical Analysis?
Forex technical analysis focuses on what has actually happened in the foreign exchange market, not what is about to happen.
Technical analysts will study price and volume changes and use the data to create charts (derived from market trader behavior) as a basic tool for analysis. Technical analysis is not concerned with the "big picture" factors affecting the market but with the activity in the financial instrument market.
There are three theoretical principles on which technical analysis relies:
1. Market behavior covers everything
The actual price is a true reflection of all the factors that will affect the market. Such as supply and demand, political factors, and market conditions. Pure technical analysts only pay attention to the market changes themselves, not the causes of market changes.
2. Price moves towards the trend
Technical analysis is often used to identify patterns of market behavior that have been significant over time. The analysis of many established patterns is likely to achieve the desired effect, and there are also some recognized patterns that are always repeated on the same basis.
3. History often repeats itself
Chart patterns have been identified and classified over the past 100 years, and the way many patterns repeat themselves leads us to the conclusion that the human mind rarely changes over time.
List of technical analysis theory categories:
Indicators (oscillating indicators, such as relative strength, refer to RSI)
Number theory (Fibonacci sequence, Gann sequence)
Wave (Elliott Wave Theory)
Gap (high, low, open, and close)
Trend (following moving averages)
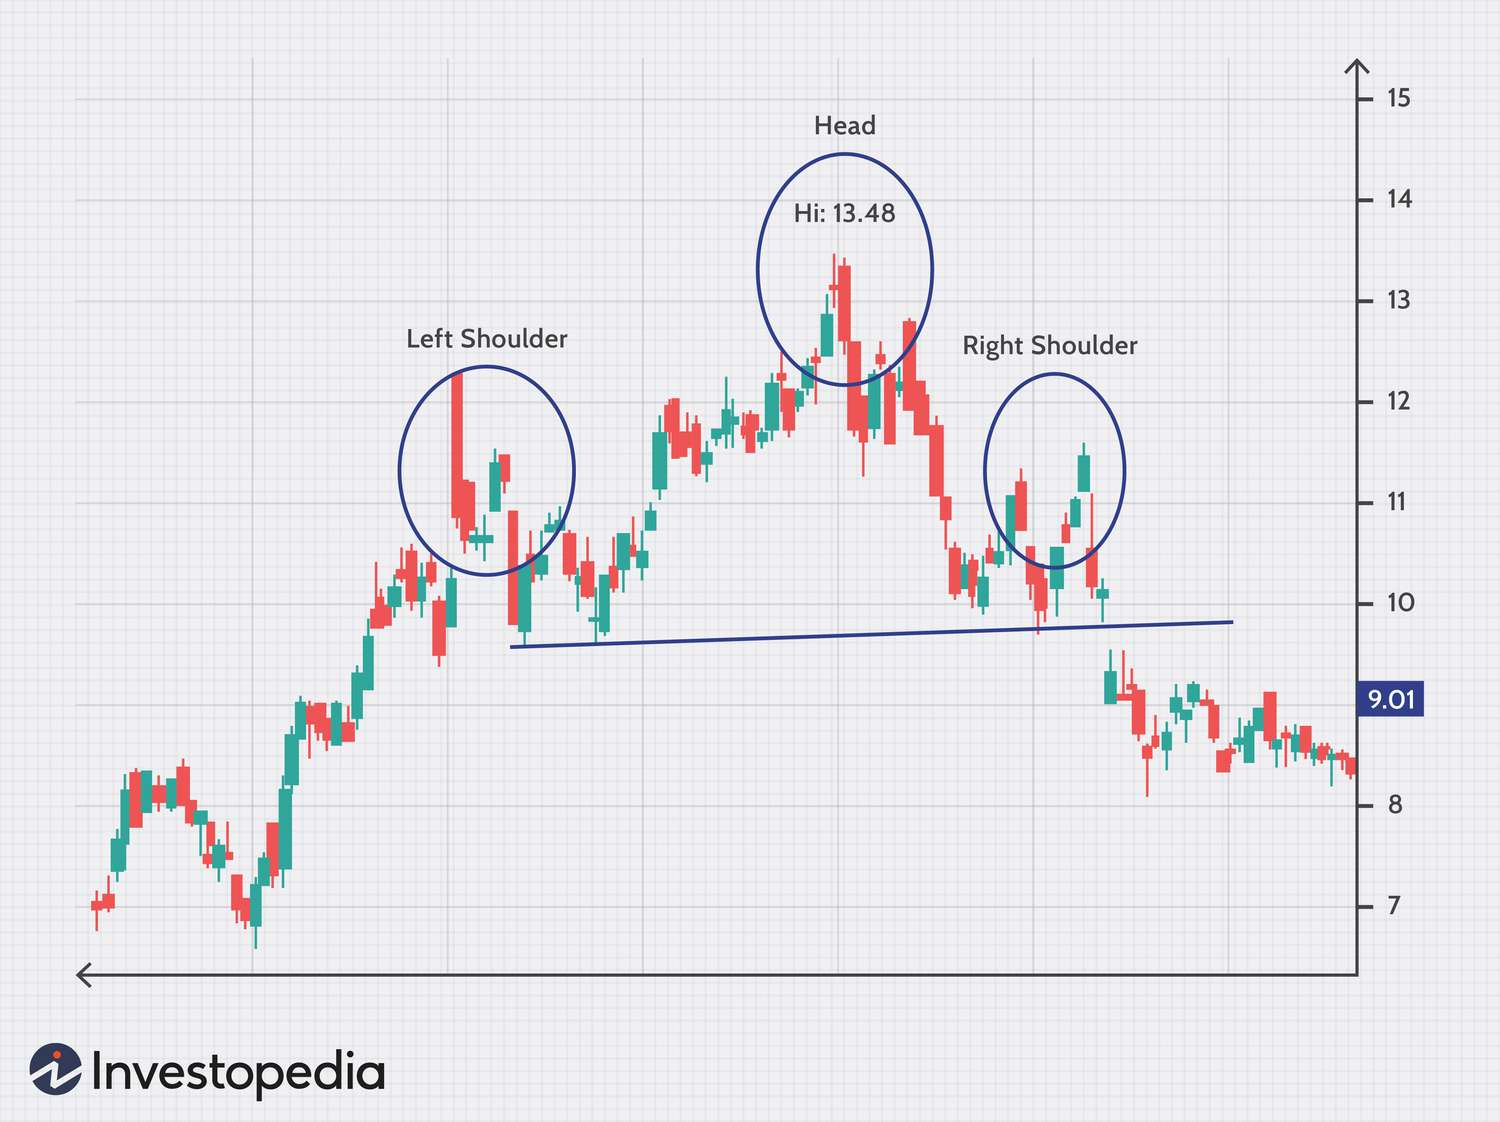
Chart Patterns (Rectangle, Head and Shoulders, Channel)
Forex Technical Indicators
What are Forex technical indicators?
A technical indicator is a series of data points used to predict currency fluctuations. Check out the most popular Forex technical indicators and learn how to build your own.
Relative Strength Index (RSI)
Stochastic index
Moving Average Convergence and Divergence (MACD)
Number theory
Wave
Gap
Trend
Chart pattern
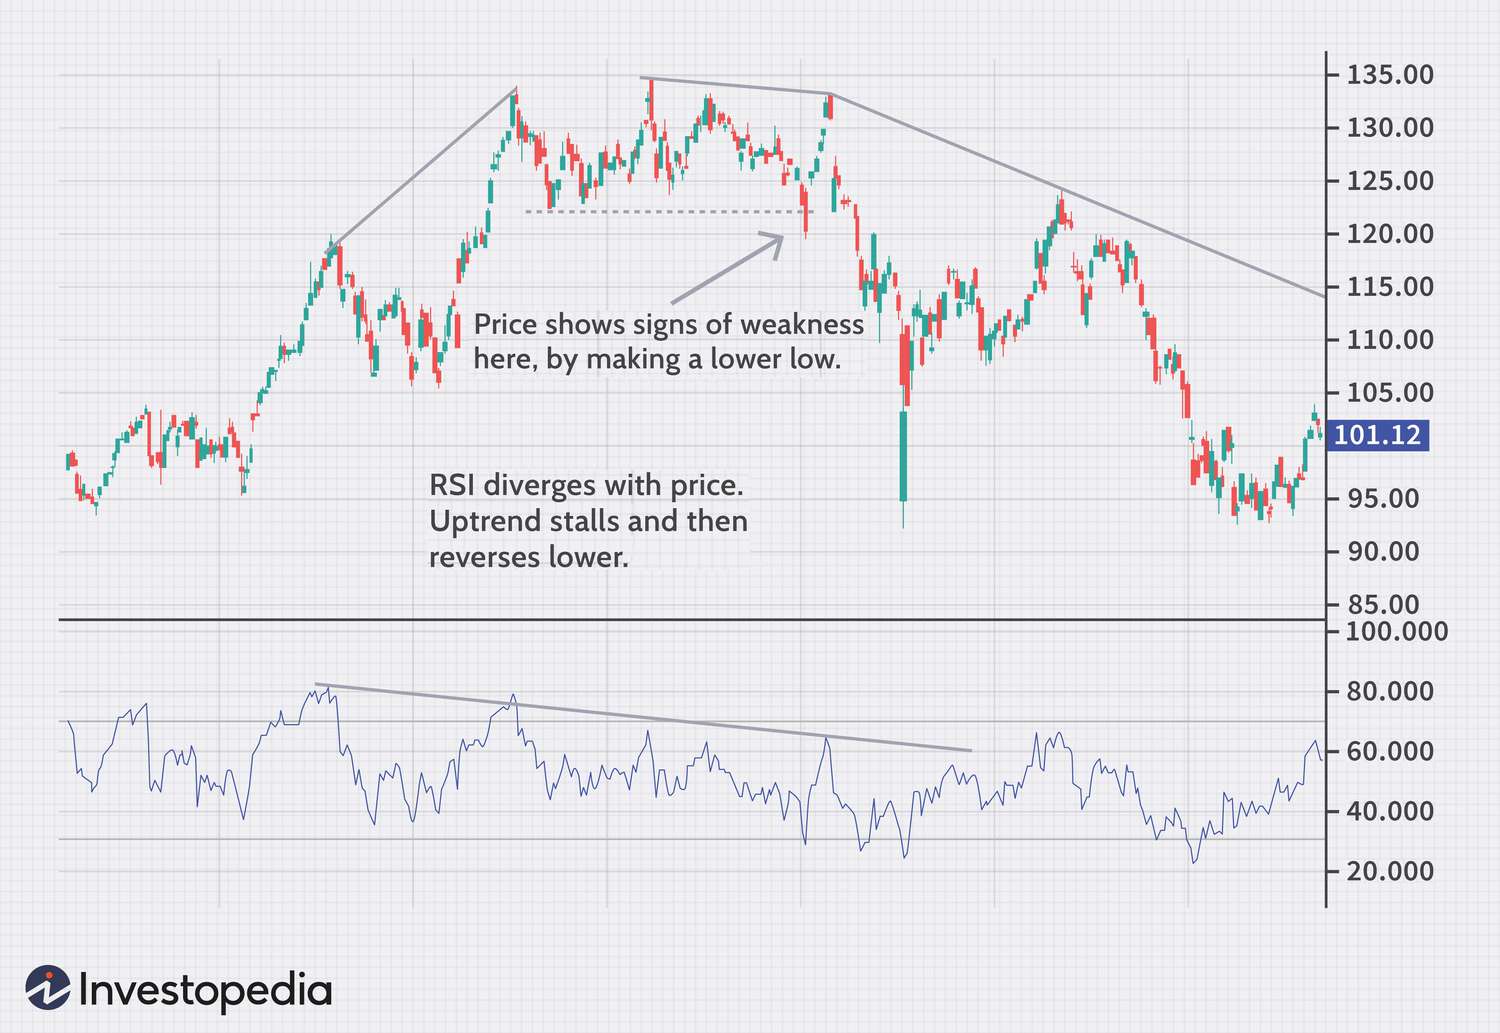
Relative Strength Index (RSI):
This index is a commonly used index in the foreign exchange (FX) market. The RSI index measures the rate of upward and downward movements. To make the calculation simple and easy to understand, the fluctuation range of the index is between 0 and 100. If the RSI index is 70 or higher, the currency is considered overbought (a situation in which prices rise higher than market expectations). If the RSI is 30 or lower, it is considered oversold (a condition in which prices fall below market expectations).
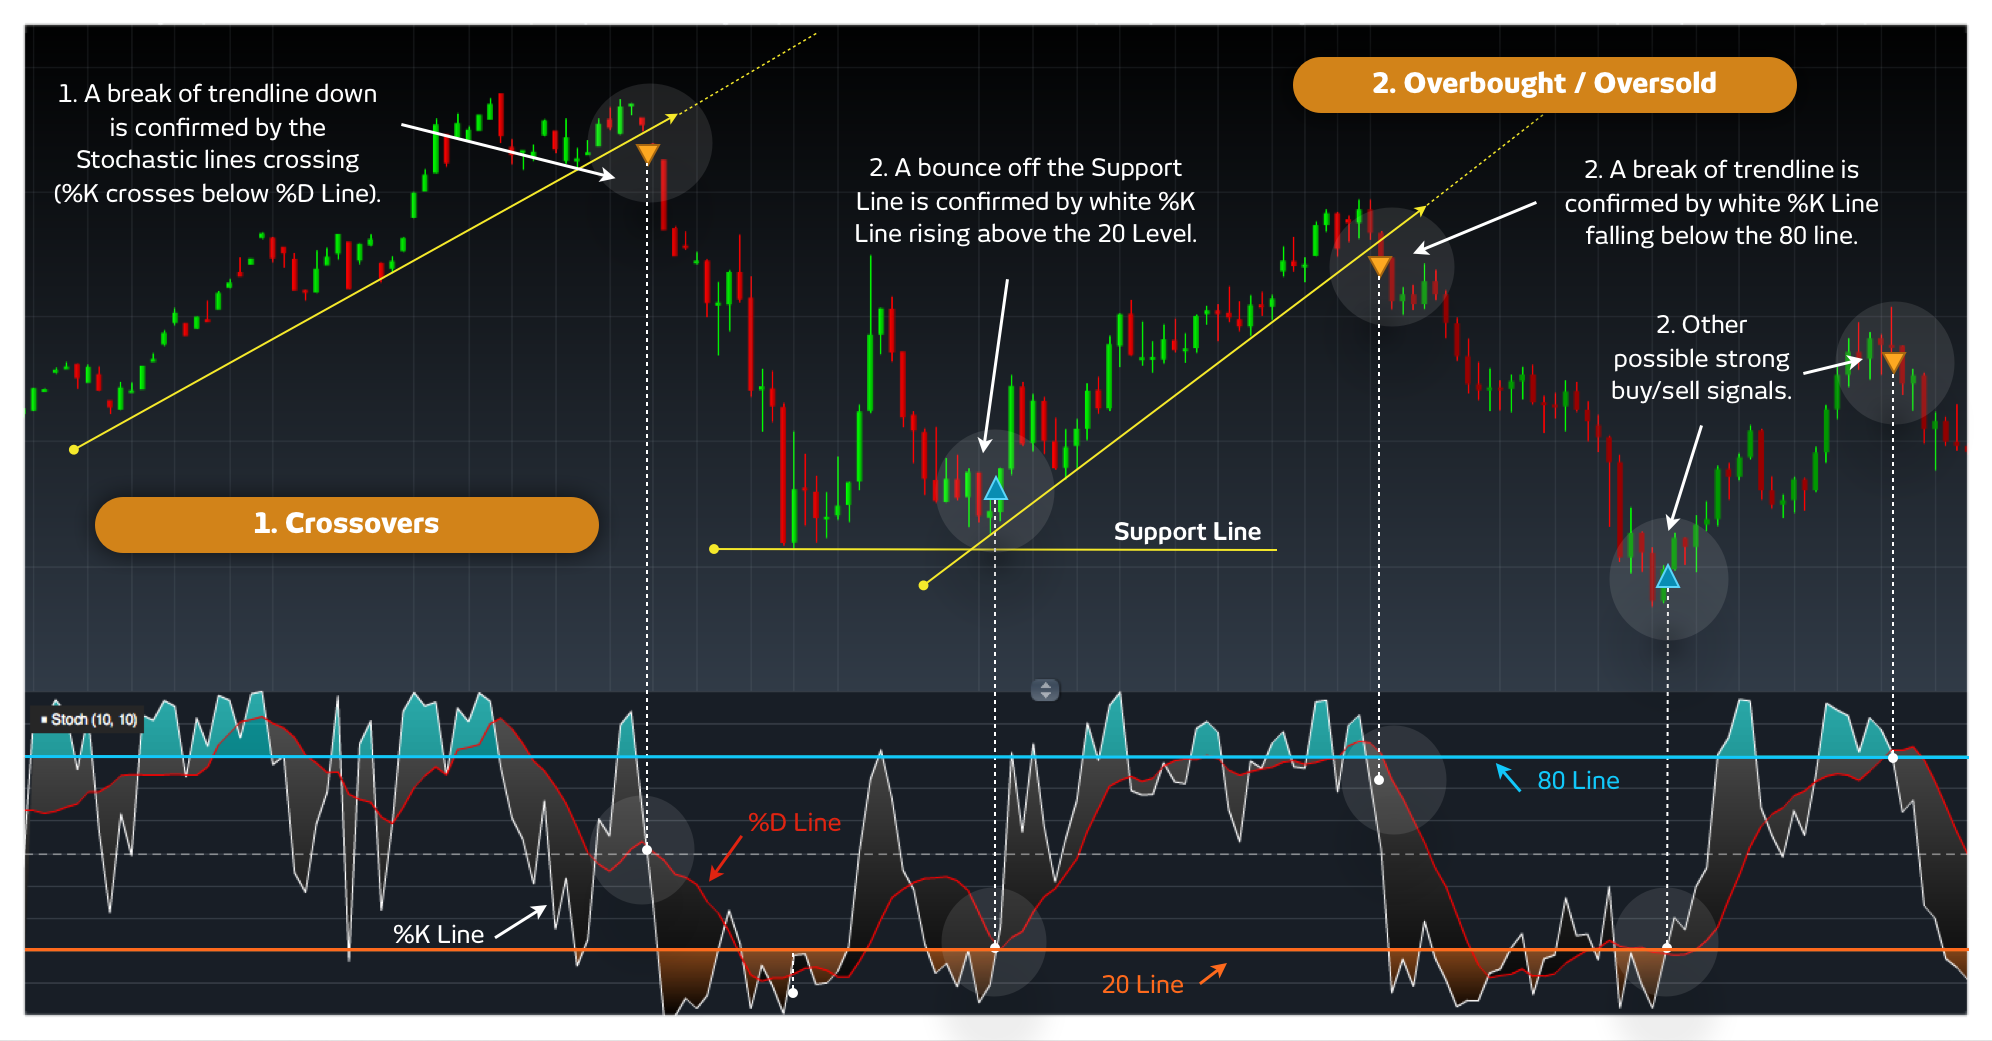
Stochastic Oscillator
This indicator shows oversold/overbought conditions on a scale of 0–100%. The index is based on the design observation that in an uptrend, the closing price will move closer to the upper end of the price range, and conversely, when the price is in a downtrend, the closing price will move closer to the lower end of the price range. The stochastic calculation involves two lines: %K and %D, which are used to show overbought/oversold areas in the chart. The divergence signal between the stochastic line and the price action in the chart below is an important trading warning.
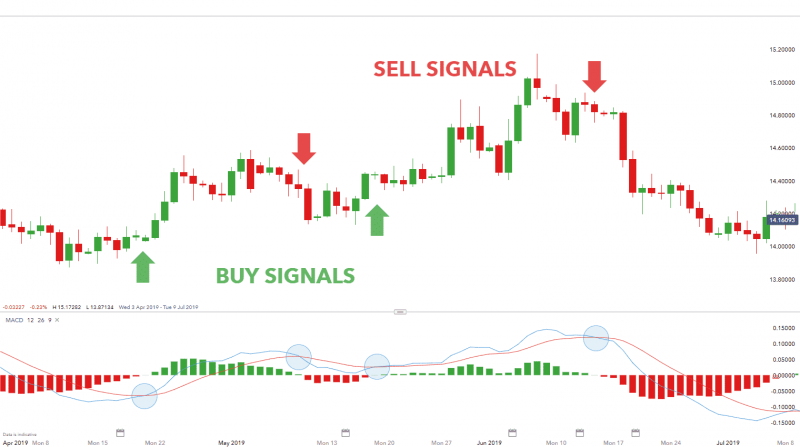
Moving Average Convergence Divergence (MACD):
This pointer involves the mapping of two variable lines. The MACD line is the difference between the two exponential moving averages, and the signal or dotted line is the exponential moving average of the difference. If the MACD average and dotted lines cross, it will be taken as a signal of an imminent trend change.
Fibonacci Sequence:
In the Fibonacci sequence (1, 1, 2,3, 5, 8, 13, 21, 34….), the third term is the sum of the first two. The ratio of the previous number to the next larger number is 62%. This number is the famous Fibonacci retracement number. The number 38%, which is the opposite of62%, is also used as a Fibonacci retracement number (used in conjunction with Elliott Wave theory; see below for details).
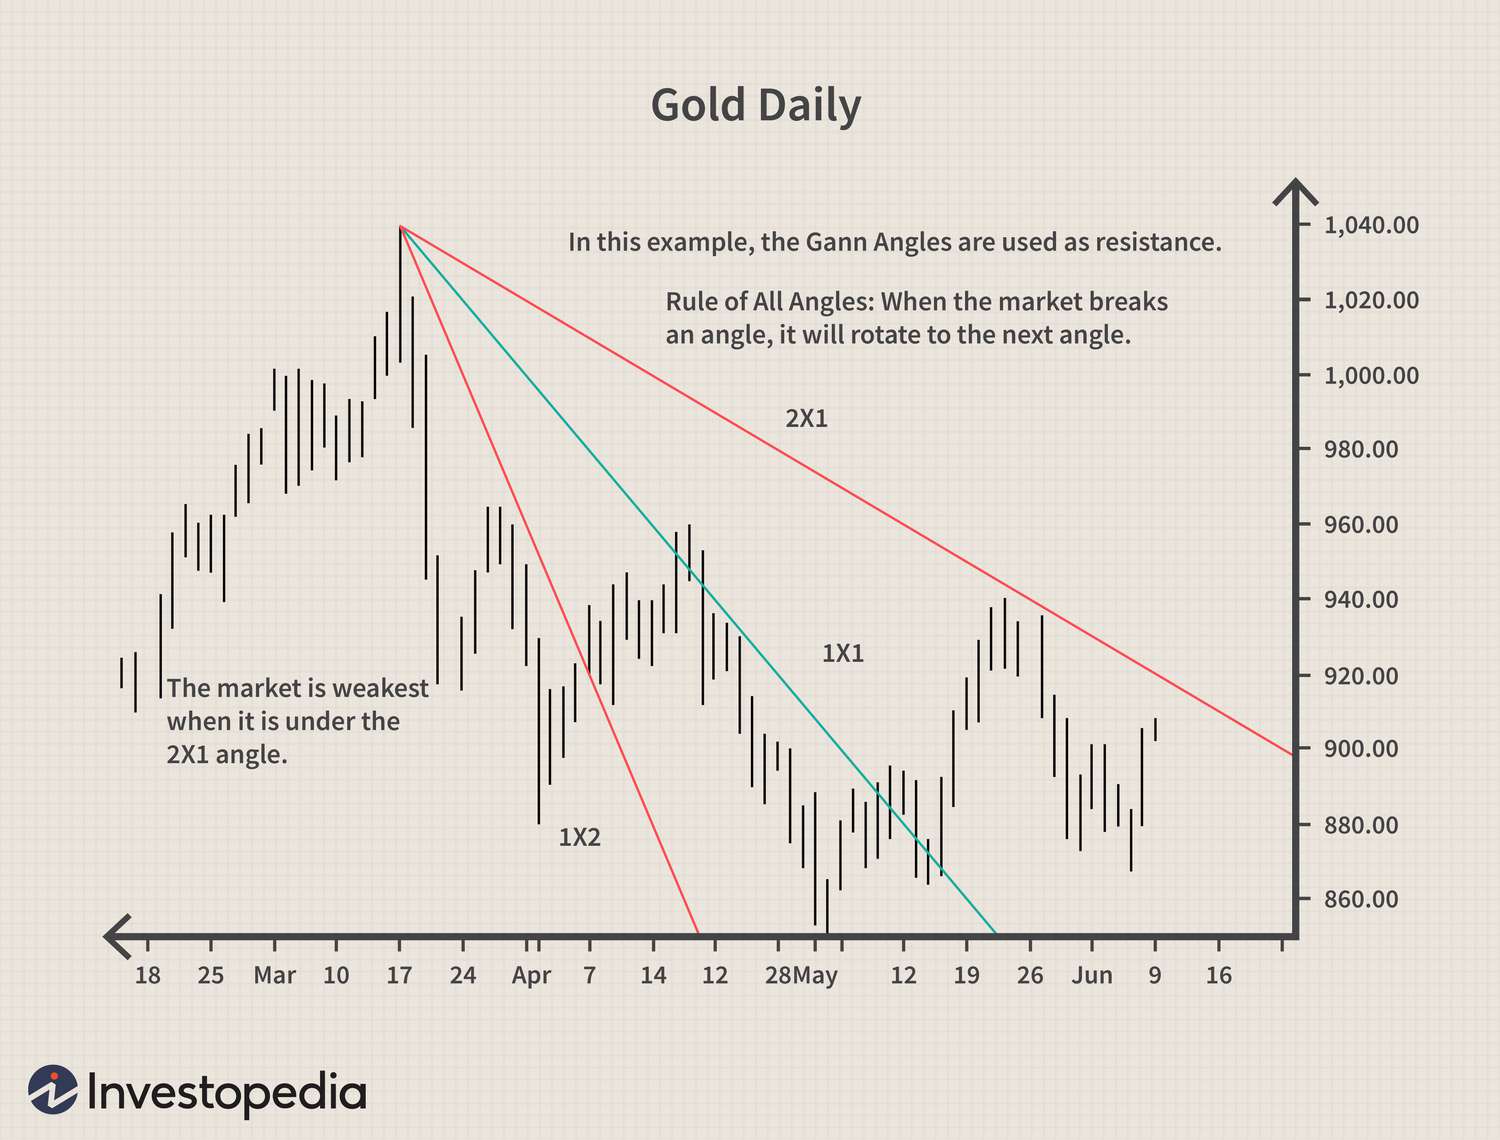
Gann Array:
W.D. Gann was a stock and commodities trader in the 1950s who gained fame by making fifty million dollars in the markets. He relied on the relationship between price movement and time—known as time/price equivalence—to develop a set of trading tools by which to make his fortune. There is no concise explanation for Gann's theory, but in essence he uses angles to delineate support and resistance areas in the chart and predicts when the future trend will change; in the chart, he also uses the line to predict the support and resistance areas.
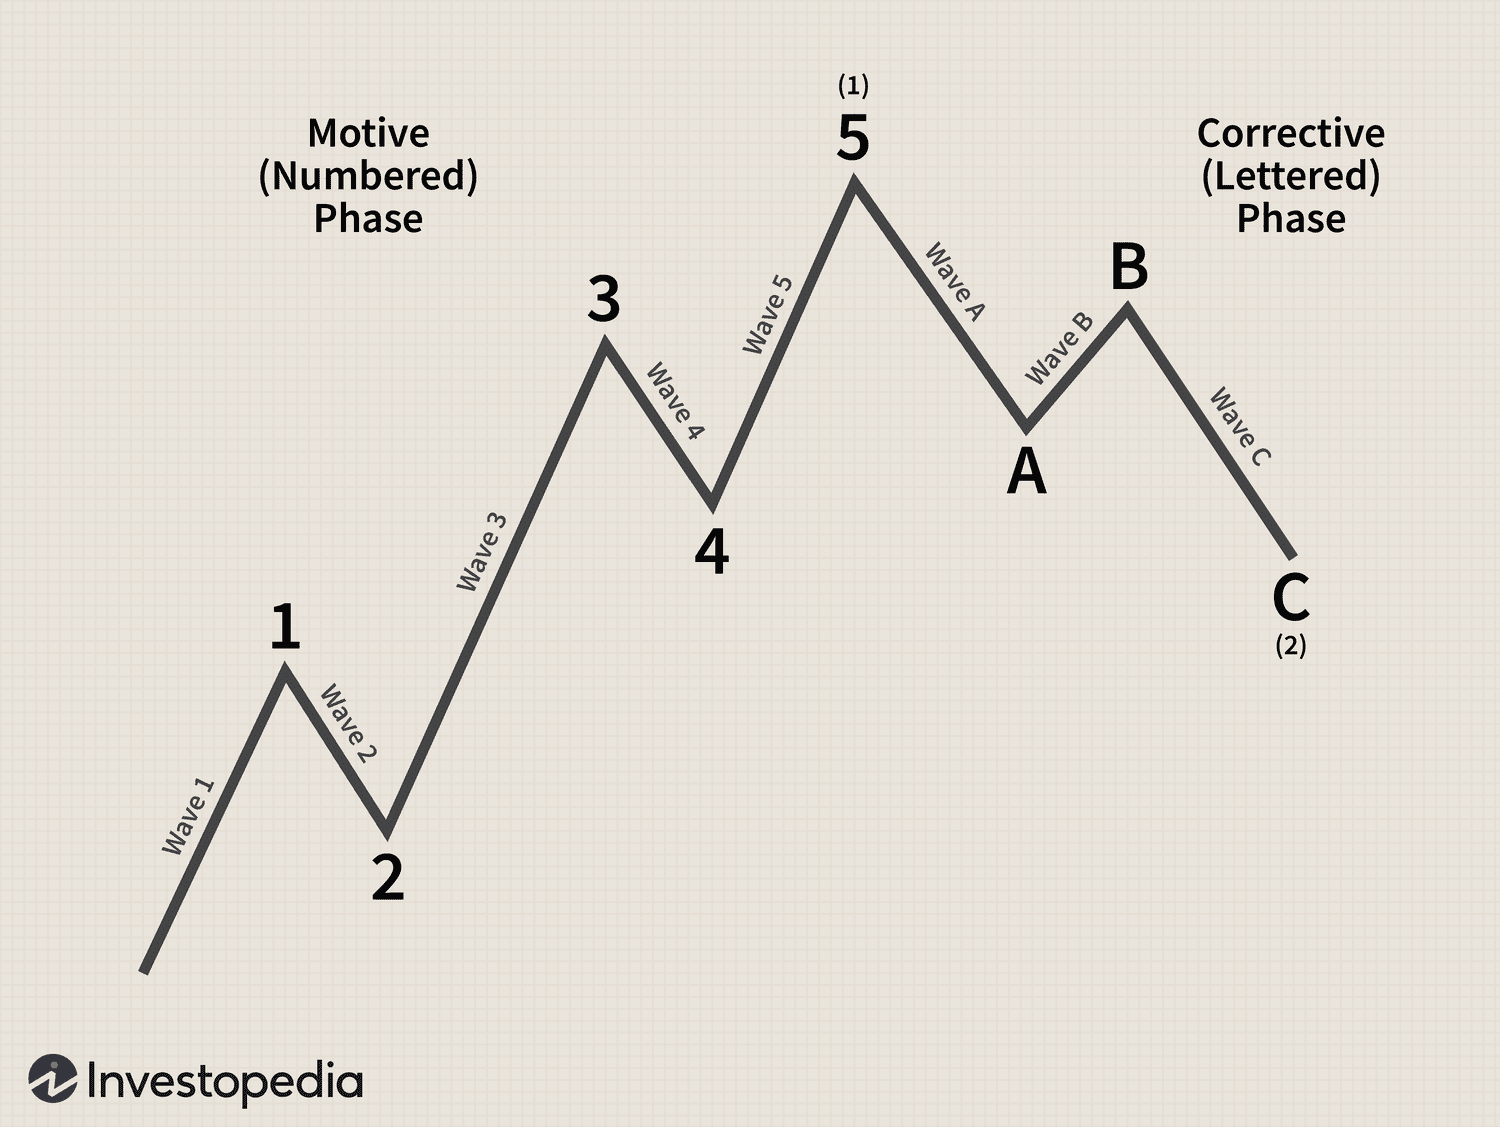
Elliott Wave Theory:
Elliott Wave Theory is a method of market analysis based on repeating wave patterns and Fibonacci sequences. An ideal Elliott Wave Pattern should consist of five rising waves and three falling waves.
Gap
A gap is an empty space on a bar chart, indicating that no trading has occurred.
When the lowest price on a certain trading day is higher than the highest price on the previous trading day, an upward gap is formed. When the highest price on a certain trading day is lower than the lowest price on the previous trading day, a downward gap is formed. An upward gap is often a signal that the market is rising; a downward gap is a signal that the market is falling. A breakout gap is a price gap that signals the end of an important price trend. It usually shows the beginning of new, important price trend.
A midline gap usually occurs in the middle of an important market trend. Therefore, it is also known as a gauge gap. Exhaustion gaps occur at the end of a major trend and signal the end of a trend. Trend Trends reflect the general direction of market price changes. Rising peaks and troughs form an uptrend; falling peaks and troughs form a downtrend. It determines the non-stationarity of the current trend. Once the exchange rate falls below this line in fluctuations, it means that the market may reverse. Peaks and troughs make up a trading range. Moving averages are used to average price information to confirm trends, support, and resistance. They can also be used for decision-making in trading strategies, especially futures trading, or to determine if the market is in an up or down trend. For simple moving averages, prices are averaged over several days.
On a continuous day, the previous price is rolled out of the average calculation domain and replaced by the current price, so the average changes every day. Exponential and weighted averages use the same method, but the price is weighted at the end of the time period instead of the current one.
Main currency markets
Foreign exchange is traded essentially in two distinctive ways. Over an organized exchange and 'over the counter'. Exchange-traded foreign exchange represents a very small portion of the total currency market: the great majority of foreign exchange deals are being traded between banks and other currency market participants 'over the counter'.
Exchange-traded currencies
In the case of an organized exchange like the Chicago Mercantile Exchange (CME) in the US, standardized currency contract sizes that represent a certain monetary value are traded in the International Money Market (IMM). A central clearing house organizes matching of transactions between counterparties. There are various disadvantages to trading currency futures, as outlined in the chapter Advantages of Trading FX.
Currency market
In comparison, the over-the-counter market is traded around the world by a multitude of participants, and price quality, reputation and trading conditions determine who a participant wishes to trade with. It is probably the most competitive market in the world, and brokers like Credit Societe must ensure they live up to the highest standards of service and are compliant with market standards and practices if they want to acquire new customers and retain their existing ones. In 1998, under the auspices of the Bank for International Settlements (BIS), the global turnover of reporting dealers was estimated at about USD 1.49 trillion per day. In comparison, currency futures turnover was estimated at USD 12 billion.
Among the various financial centers around the world, the largest amount of foreign exchange trading takes place in the United Kingdom, even though that nation's currency, the British pound, is less widely traded in the currency market than several others. As shown in the graph underneath, the United Kingdom accounts for about 32 percent of the global total; the United States ranks a distant second with about 18 percent, and Japan is third with 8 percent.
How Interest Rate Increases Drive Currency Spikes
A common way to think about U.S. interest rates is how much it’s going to cost to borrow money, whether for our mortgages or how much we’ll earn on our bond and money market investments. Currency traders think bigger. Interest rate policy is actually a key driver of currency prices and a great “starter” strategy for new currency traders.
Fundamentally, if a country raises its interest rates, the currency of that country will strengthen because the higher interest rates attract more foreign investors. When foreign investors invest in U.S. treasuries, they must sell their own currency and buy U.S. Dollars in order to purchase the bonds. If you believe U.S. interest rates will continue to rise, you could express that view by going long U.S. Dollars.
If you believe that the Fed has finished raising rates for the time being, you could capitalize on that view by buying a currency with a higher interest rate, or at least the prospect of relatively higher rates. For example, U.S. rates may be higher than those of Eurozone now, but the prospect of higher rates in Eurozone, albeit still lower than the U.S., may drive investors to purchase Euros.
Capitalize on Rising Gold Prices with Currencies
It’s not hard to understand why we’ve experienced a run-up in gold prices lately. In the US, we’re dealing with the threat of inflation and a lot of geo-political tension. Historically, gold has been a country-neutral alternative to the U.S. dollar. So given the inverse relationship between gold and the U.S. Dollar, currency traders can take advantage of volatility in gold prices in innovative ways.
For example, if gold breaks an important price level, one would expect it to move higher in the coming periods. With this in mind, forex traders would look to sell dollars and buy Euros, for example, as a proxy for higher gold prices. Moreover, higher gold prices frequently have a positive impact on the currencies of major gold producers. For example, Australia is the world's third-largest exporter of gold, and Canada is the world's third-largest producer of gold. Therefore, if you believe the price of gold will continue to rise, you could establish long positions in the Australian Dollar or the Canadian Dollar—or even position to be long in those currencies against other major countries like the UK or Japan.
Translating Rising Oil Prices to Profitable Currency Moves
Equity investors already know that higher oil prices negatively impact the stock prices of companies that are highly dependent on oil, such as airlines, since more expensive oil means higher expenses and lower profits for those companies.
In much the same way, a country's dependency on oil determines how its currency will be impacted by a change in oil prices. The US’s massive foreign dependence on oil makes the US dollar more sensitive to oil prices than other countries. Therefore, any sharp increase in oil prices is typically dollar-negative.
If you believe the price of oil will continue to increase in the near term, you could express that viewpoint in the currency markets by once again favoring commodity-based economies like Australia and Canada or selling other energy-dependent countries like Japan.
What is Forex technical analysis?
Forex technical analysis is concerned with what has actually happened in the Forex market rather than what should happen.
A technical analyst will study the price and volume movements and, from that data, create charts (derived from the actions of the market players) to use as their primary tool. The technical analyst is not as concerned with any of the “bigger picture” factors affecting the market as the fundamental analyst, but concentrates on the activity of that instrument’s market.
Technical analysis is based on three underlying principles:
1. Market action discounts everything
This means that the actual price is a reflection ofeverything that is known to the market that could affect it. For example:
supply and demand
political factors
market sentiment
The pure technical analyst is only concerned with price movements and not with the reasons for any changes.
2. Prices move in trends
Technical analysis is used to identify patterns of market behavior that have long been recognized as significant. For many given patterns, there is a high probability that they will produce the expected results. Also, there are recognized patterns that repeat themselves on a consistent basis.
3. History repeats itself
Chart patterns have been recognized and categorized for over 100 years, and the manner in which many patterns are repeated leads to the conclusion that human psychology changes little with time.
List of categories of the technical analysis theory:
Indicators (Oscillators, e.g.: Relative Strength Index RSI)
Number theory (Fibonacci numbers, Gann numbers)
Waves (Elliott wave theory)
Gaps (High-Low, Open-Closing)
Trends (Following Moving Average)
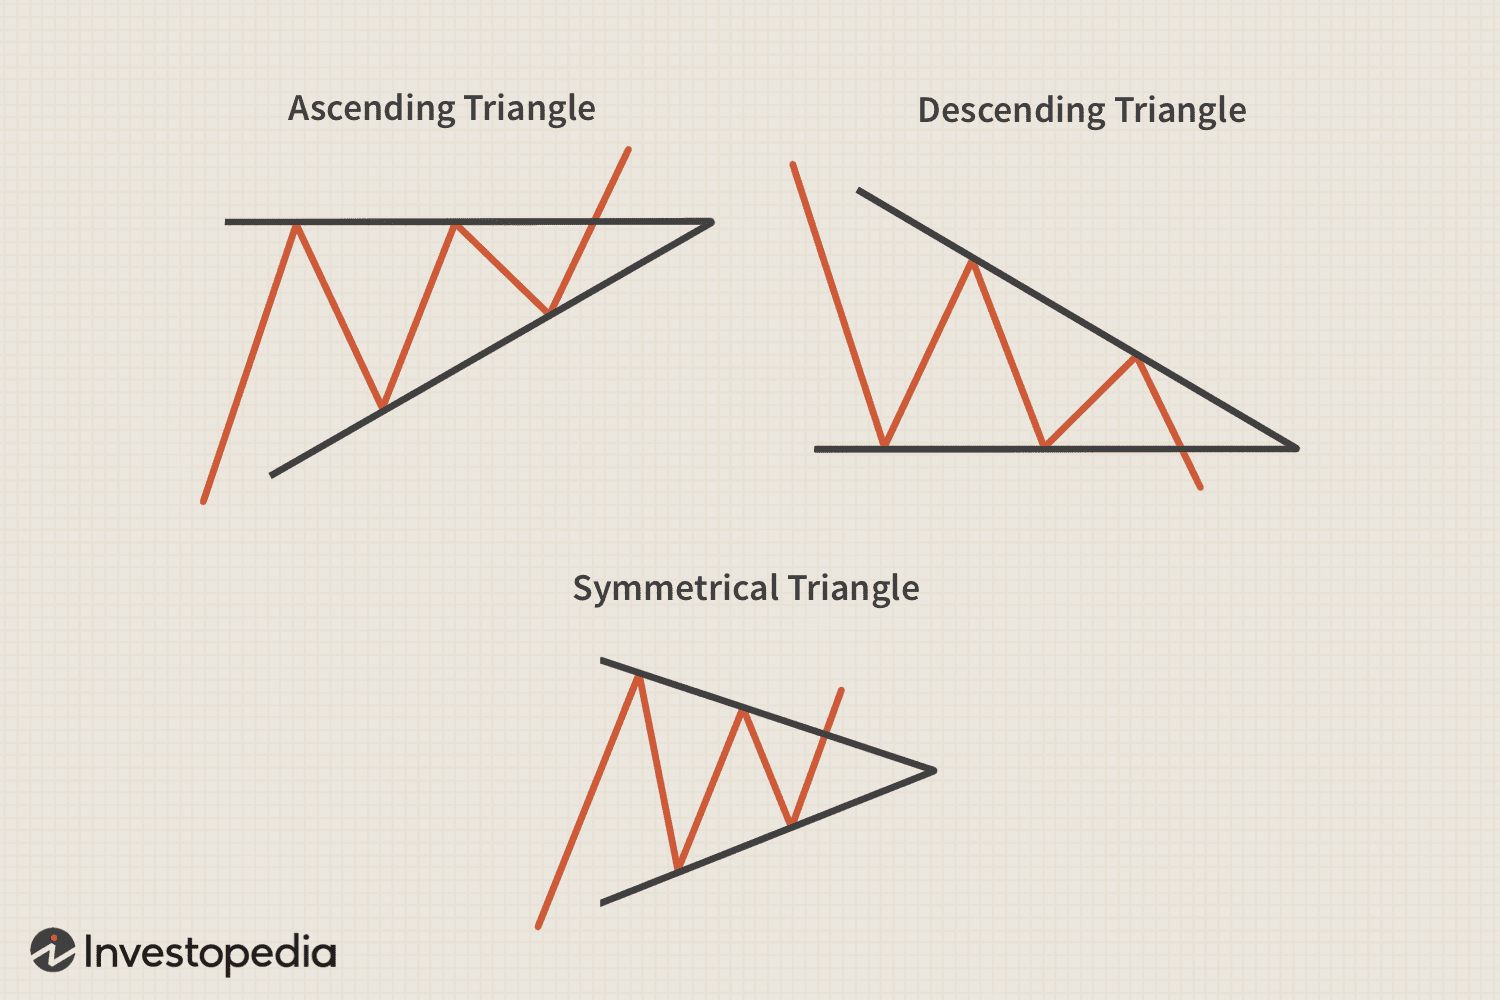
Chart formations (Triangles, Head& Shoulders, Channels)
Introduction to Technical Analysis
Technical analysis is a method of forecasting price movements by looking at purely market-generated data. Price data from a particular market is most commonly the type of information analyzed by a technician, though most will also keep a close watch on volume and open interest in futures contracts. The bottom line when utilizing any type of analytical method, technical or otherwise, is to stick to the basics, which are methodologies with a proven track record over a long period of time. After finding a trading system that works for you, the more esoteric fields of study can then be incorporated into your trading toolbox.
Almost every trader uses some form of technical analysis. Even the most reverent follower of market fundamentals is likely to glance at price charts before executing a trade. At their most basic level, these charts help traders determine the ideal entry and exit points for a trade. They provide a visual representation of the historical price action of whatever is being studied. As such, traders can look at a chart and know if they are buying at a fair price (based on the price history of a particular market), selling at a cyclical top, or perhaps throwing their capital into a choppy, sideways market. These are just a few market conditions that charts identify for a trader. Depending on their level of sophistication, charts can also help with much more advanced studies of the markets.
On the surface, it might appear that technicians ignore the fundamentals of the market while surrounding themselves with charts and data tables. However, a technical trader will tell you that all of the fundamentals are already represented in the price. They are not so much concerned that a natural disaster or an awful inflation number caused a recent spike in prices as much as how that price action fits into a pattern or trend, and, much more to the point, how that pattern can be used to predict future prices.
Technical analysis assumes that:
All market fundamentals are depicted in the actual market data. So, the actual market fundamentals and various factors, such as the differing opinions, hopes, fears, and moods of market participants, need not be studied.
History repeats itself, and therefore markets move in fairly predictable, or at least quantifiable, patterns. These patterns, generated by price movement, are called signals. The goal of technical analysis is to uncover the signals given off in a current market by examining past market signals. Prices move in trends. Technicians typically do not believe that price fluctuations are random and unpredictable. Prices can move in one of three directions: up, down, or sideways. Once a trend in any of these directions is established, it will usually continue for some time. The building blocks of any technical analysis system include price charts, volume charts, and a host of other mathematical representations of market patterns and behaviors. Most often called studies, these mathematical manipulations of various types of market data are used to determine the strength and sustainability of a particular trend. So, rather than simply relying on price charts to forecast future market values, technicians will also use a variety of other technical tools before entering a trade.
As in all other aspects of trading, be very disciplined when using technical analysis. Too often, a trader will fail to sell or buy into a market even after it has reached a price that his or her technical studies identified as an entry or exit point. This is because it is hard to screen out the fundamental realities that led to the price movement in the first place.
As an example, let's assume you are long USD vs. euro and have established your stop/loss 30 pips away from your entry point. However, if some unforeseen factor is responsible for pushing the USD through your stop/loss level, you might be inclined to hold this position just a bit longer in the hopes that it turns back into a winner. It is very hard to make the decision to cut your losses and even harder to resist the temptation to book profits too early on a winning trade. This is called leaving money on the table. A common mistake is to ride a loser too long in the hopes it comes back and to cut a winner way too early. If you use technical analysis to establish entry and exit levels, be very disciplined in following through on your original trading plan.
Price charts
Bar chart patterns
There are a variety of charts that show price action. The most common are bar charts. Each bar will represent one period of time, and that period can be anything from one minute to one month to several years. These charts will show distinct price patterns that develop over time.
Candlestick patterns
Like bar chart patterns, candlestick patterns can be used to forecast the market. Because of their colored bodies, candlesticks provide greater visual detail in their chart patterns than bar charts.
Point & Figure patterns
Point and figure patterns are essentially the same patterns found in bar charts, but X's and O's are used to market changes in price direction. In addition, point and figure charts make no use of time scales to indicate the particular day associated with certain price action.
Technical Indicators
Here are a few of the more common types of indicators used in technical analysis:
Trend indicators
Trend is a term used to describe the persistence of price movement in one direction over time.
Trends move in three directions: up, down, and sideways.
Trend indicators smooth variable price data to create a composite of market direction.
(Example: Moving Averages, Trend Lines)
Strength indicators
Market strength describes the intensity of market opinion with reference to a price by examining the market positions taken by various market participants.
Volume or open interest are thebasic ingredients of this indicator.
Their signals are coincidental or leading the market.
(Example: Volume)
Volatility indicators
Volatility is a general term used to describe the magnitude, or size, of day-to-day price fluctuations, independent of their direction. Generally, changes in volatility tend to lead to changes in prices.
(Example: Bollinger Bands)
Cycle indicators
A cycle is a term to indicate repeating patterns of market movement specific to recurrent events such as seasons, elections, etc.
Many markets have a tendency to move in cyclical patterns.
Cycle indicators determine the timing of particular market patterns.
(Example: Elliott Wave)
Support/resistance indicators
Support and resistance describe the price levels at which markets repeatedly rise or fall and then reverse.
This phenomenon is attributed to basic supply and demand.
(Example: Trend Lines)
Momentum indicators
Momentum is a general term used to describe the speed at which prices move over a given time period. Momentum indicators determine the strength or weakness of a trend as it progresses overtime.
Momentum is highest at the beginning of a trend and lowest at trend turning points.
Any divergence of directions in price and momentum is a warning of weakness; if price extremes occur with weak momentum, it signals the end of movement in that direction.
If momentum is trending strongly and prices are flat, it signals a potential change in price direction.
(Example: Stochastic, MACD, RSI)
Forex technical indicators
A good understanding of the basic tenets of technical analysis can vastly improve one's trading skills.
When using technical analysis, price is the primary tool. Simply put, "everything is already in the rate." However, technical analysis involves a bit more than simply staring at the price charts and hoping to find a "yellow brick road" to instant wealth. Along with various methods of plotting price action on charts by using bars, candlesticks, and X's and O's on point and figure charts, market technicians also employ many technical studies that help them delve deeper into the data. By using these studies in conjunction with their price charts, traders are able to build much stronger cases to buy, sell, or remain on the sidelines than they could by simply looking at price charts alone.
Here are descriptions of some of the more widely used and time-tested studies that technicians keep in their toolboxes:
One of the most basic and widely used indicators in a technical analyst's toolbox, moving averages help traders verify existing trends, identify emerging trends, and view overextended trends about to reverse. Moving averages are lines overlaid on a chart indicating long-term price trends with short-term fluctuations smoothed out.
There are three basic types of moving averages:
A simple moving average
Gives equal weight to each price point over the specified period. The user defines whether the high, low, or close is used, and these price points are added together and averaged. This average price point is then added to the existing string, and a line is formed. With the addition of each new price point, the sample set drops off at the oldest point. The simple moving average is probably the most widely used moving average.
A weighted moving average
Gives more emphasis to the latest data. A weighted moving average multiplies each data point by a weighting factor that differs from day to day. These figures are added and divided by the sum of the weighting factors. A weighted moving average allows the user to successfully smooth out a curve while having the average more responsive to current price changes.
An exponential moving average
This is another way of "weighting" the more recent data. An exponential moving average multiplies a percentage of the most recent price by the previous period's average price. Defining the optimum moving average for a particular currency pair involves "curve fitting". Curve fitting is the process of selecting the right number of periods with the correct type of moving average to produce the results the user is trying to achieve. By trial and error, technicians work with the time periods to fit the price data.
Because the moving average is constantly changing based on the latest market data, many traders will use different "specified" time frames before they come up with a series of moving averages that are optimal for a particular currency.
For example, a trader might create a 5-day, a 15-day, and a 30-day moving average for a currency and then plot them on his or her price chart. He might start out using simple moving averages and end up using weighted moving averages. In creating these moving averages, traders need to decide on the exact price data that will be used in this study, meaning closing prices vs. opening prices vs. high/low/close, etc. After doing so, a series of lines are created that reflect the 5-day, 15-day, and 30-day moving averages of a currency.
Once the data is layered over a price chart, traders can determine how well these chosen periods keep track of the trend being followed. If, for example, a market is trending higher, you'd expect the 30-day moving average to be a very accurate trend line, providing a line of support for prices on their way higher. If prices seem too close under this 30-day moving average on several occasions without resulting in a halt in the uptrend, a trader will simply adjust the time period to say a 45-day or 60-day moving average in order to optimize the average. In this way, the moving average will act as a trend line.
After determining the optimum moving average for a currency, this average price line can be used as a line of support in maintaining a long position or resistance in maintaining a short position. Breaches of this line can also be used as a signal that a currency is in the process of reversing course, in which case a trader will want to pare back an existing position or come up with entry levels for a new position. For example, if you determine that a 30-day moving average has shown itself to be a good support line for USD-JPY in an upward trending market, then market closes under this 30-daymoving average line could be a signal that this trend could be running out of steam. However, it is important to wait for confirmation of these signals. Oneway to do this is to wait for another close below the level. On the second close under the average, you should begin to pare down your position. Another confirmation involves using other, shorter-term moving averages.
While a longer-term moving average can help define and support a particular trend, shorter-term moving averages can provide signals that a trend is ending before prices dip below your longer-term moving average line. For this reason, most traders will plot several moving averages on the same chart. In a market that is trending higher, a shorter-term moving average might signal a market reversal by turning down and crossing over the longer-term moving average. For example, if you are using a 15-day and a 45-day moving average in a market that is in an uptrend and the 15-day moving average turns down and crosses over the45-day moving average, this could be an early signal that the uptrend is ending and it is probably time to begin to pare down your position.
Stochastic studies, or oscillators, are another useful tool for monitoring the expected sustainability of a trend. They provide a trader with information about the closing price in the current trading period relative to the prior performance of the instrument being analyzed.
Stochastics are measured and represented by two different lines, %K and %D, and are plotted on a scale ranging from 0 to 100. Indications above 80 represent strong upward movements, while indications below 20 represent strong downward movements. The mathematics behind the studies are not as important as knowing what the Stochastics are telling you. The %K line is the faster, more sensitive indicator while the %D line takes more time to turn. When the %K line crosses over the %D line, this could be an indication that the market is about to reverse course. Stochastic studies are not useful in choppy, sideways markets. At times when prices are fluctuating in a narrow range, the %K and %D lines might be crossing many different times and will be telling you nothing more than that the market is moving sideways.
Stochastic are most useful in measuring the strength of a trend and as augurs of a coming reversal in prices. When prices are making new highs or lows and your Stochastics are doing the same, you can be reasonably certain that the trend will continue. On the other hand, many traders find that the best trading opportunity comes when their stochastic indicator is flattening out or moving in the opposite direction of prices. When these divergences occur, it's time to book profits and/or establish a position in the opposite direction of the prior trend.
As should always be the case when using any technical tool, do not act on the first signal you see. Wait at least one or two trading sessions for confirmation of what the study is indicating before you commit toa position.
The Relative Strength Index (RSI) measures the momentum of price movements. It is also plotted on a scale ranging from 0 to 100. Traders will tend to look at RSI readings over 80 as an indicator of a market that is overbought or susceptible to a downturn, and readings under 20 as a market that is oversold or ready to turn higher.
This logic therefore implies that prices cannot rise or fall forever and that, by using an RSI study, one can determine with a reasonable degree of certainty when a reversal will come about. However, be very wary of trading on RSI studies alone. In many instances, an RSI can remain at very lofty or sunken levels for quite a while without prices reversing course. At these times, the RSI is simply telling you that the market is quite strong or quite weak and shows no signs of changing course.
RSI studies can be adjusted to whatever time sensitivity a trader feel is necessary for his or her particular style. For instance, a 5-day RSI will be very sensitive and will tend to give many more signals, not all of them sustainable, than, say, a 21-day RSI, which will tend to be less choppy. As with other studies, try a variety of time periods for the currency that you are trading based on your trading style. Longer-term, position-type traders will tend to find that shorter time frames used for an RSI (or any other study for that matter) will give too many signals and will result in over-trading. On the other hand, shorter time frames will probably be ideal for day traders trying to capture many shorter-term price fluctuations.
As with Stochastics, look for divergences between prices and the RSI. If your RSI turns up in a slumping market or turns down during a bull run, this could be a good indication that a reversal is just around the corner. Wait for confirmation before you act on divergent indications from your RSI studies.
Bollinger Bands are volatility curves used to identify extreme highs or lows in relation to price. Bollinger Bands establish trading parameters, or bands, based on the moving average of a particular instrument and a set number of standard deviations around this moving average.
For example, a trader might decide to use a 10-day moving average and 2 standard deviations to establish Bollinger Bands for a given currency. After doing so, a chart will appear with price bars capped by an upper boundary line based on price levels 2 standard deviations higher than the10-day moving average and supported by a lower boundary line based on price levels 2 standard deviations lower than the 10-day moving average. In the middle of these two boundary lines will be another line running somewhat close to the middle area, depicting, in this case, the 10-day moving average. Both the moving average and the number of standard deviations can be altered to best suit a particular currency.
Jon Bollinger, creator of Bollinger Bands, recommends using a simple 20-daymoving average and 2 standard deviations. Because standard deviation is a measure of volatility, Bollinger Bands are dynamic indicators that adjust themselves (widen and contract) based on the current levels of volatility in the market being studied. When prices hit the upper or lower boundaries of a given set of Bollinger Bands, this is not necessarily an indication of an imminent reversal in a trend. It simply means that prices have moved beyond the upper limits of the established parameters. Therefore, traders should use another study in conjunction with Bollinger Bands to help them determine the strength of a trend.
The Moving Average Convergence Divergence (MACD) is a more detailed method of using moving averages to find trading signals from price charts. Developed by Gerald Appel, the MACD plots the difference between a 26-day exponential moving average and a 12-day exponential moving average. A 9-day moving average is generally used as a trigger line, meaning when the MACD crosses below this trigger, it’s a bearish signal, and when it crosses above it, it's a bullish signal. As with other studies, traders will look to MACD studies to provide early signals or divergences between market prices and a technical indicator. If the MACD turns positive and makes higher lows while prices are still tanking, this could be a strong buy signal. Conversely, if the MACD makes lower highs while prices are making new highs, this could be a strong bearish divergence and a sell signal.
Fibonacci Retracement levels are a sequence of numbers discovered by the noted mathematician Leonardo da Pisa during the twelfth century. These numbers describe cycles found throughout nature and, when applied to technical analysis, can be used to find pullbacks in the currency market.
Fibonacci Retracement involves anticipating changes in trends as prices near the lines created by the Fibonacci studies. After a significant price move (either up or down), prices will often retrace a significant portion (if not all) of the original move. As prices retrace, support and resistance levels often occur at or near the Fibonacci Retracement levels.
In the currency markets, the commonly used sequence of ratios is 23.6%, 38.2%, 50%, and 61.8%. Fibonacci Retracement levels can easily be displayed by connecting a trend line from a perceived high point to a perceived low point. By taking the difference between the high and low, the user can apply the % ratios to achieve the desired pullbacks.
One final word of advice: Don't get too caught up in the mathematics involved in putting together each study. It is much more important to understand how and why studies can and should be manipulated based on the time periods and sensitivities that you determine are ideal for the currency you are trading. These ideal levels can only be determined after applying several different parameters to each study until the charts and studies begin to reveal the "details behind the details."
Credit Societe clients executing trades on our online trading platform as opposed to one of our competitors' platforms can save quite a few pips per trade due to the following features:
EXTREMELY COMPETITIVE EXECUTION
1. Spreads as low as 0.8 pip!
Most online Forex brokers offer 1-5. Credit Societe offers spreads as low as 0.8 pip! Less spread means less cost, which means more profits.
2. ESP dealing (Executable Streaming Price feed), no RFQ (request for quote).
Most brokers still offer RFQ execution. Most customers don't even understand how much money they lose using such a system, and those brokers directly benefit from the request for quote method of execution.
RFQ works in the following manner:
- The client clicks on bid or ask to ask for a quote (therefore divulging his intention).
- The broker, knowing the client's intention, quotes him a worse quote.
- The client accepts the quote because the difference remains minimal in his eyes.
- The client probably doesn't realize that doing this repeatedly can be extremely costly.
Credit Societe takes the onerous concept of requoting out of the equation. Our system is only ESP (executable streaming price) capable, which means that customers click only once to trade.
ESP works in the following manner:
- The client clicks on bid or ask to execute immediately.
This is purely ONE CLICK DEALING and is the most competitive way of trading Foreign Exchange.
3. WYCIWYG execution, no slippage.
What you click is what you get. In contrast to competitor firms at Credit Societe no execution ever occurs at another price other than the one you've clicked on.
4. Guaranteed orders in all market conditions!
Limit, stop, if done, and trailing stop orders are always executed at the specified price in all market conditions, regardless of how volatile! Basically, there's no slippage whatsoever.
5. Constant liquidity.
Credit Societe partners only with the largest and most famous Forex Institutions that collectively represent over 55% of daily global Forex Market Liquidity. The higher the liquidity, the easier it is to enter and exit the market.
With Credit Societe's WYCIWYG execution, Forex Trader makes transactions on a 1-5 pip fixed spread with no re-quotes, no slippage, and instant execution. No other dealer offers such a sharply competitive online execution service. Don't settle for less than the most competitive execution!
Speculation VS investment - Day Trading VS Occasional Position
It is very important that the individual wanting to trade foreign exchange be aware of the very marked difference between speculation and investment. Forex trading is, by nature, a speculative occupation. Foreign exchange markets are among the most volatile markets in the world. When traded on a margined basis, they effectively become the most volatile in the world.
Day trading
Day trading in foreign exchange can be extremely profitable, and high-risk profile traders can generate huge percentage returns even overnight.
Day trading is, however, amentally and psychologically challenging activity and is by no means meant foreveryone.
Day trading is essentiallyspeculation, and day traders essentially only do that: day trading.
Most people who trade foreignexchange are not professional day traders, however.
Day trading alternative
Often, the contractors of foreign exchange brokerage services are professionals in some capacity or another.
These people do not day trade but take occasional positions from time to time.
This is also speculation and should not be confused with making an investment.
Conclusion
The conclusion here is that the nature of foreign exchange trading does not lend itself as much to investment as it does to speculation and hedging (hedging may be performed in forward instruments).
It is possible, in a sense, to make an investment in foreign exchange over a long-term period, but this necessitates a large account value and low leveraging.
Profit and Loss
Profit and Loss (P&L) for every position is calculated in real-time on Credit Societe’s Forex trading platform. This enables traders to track their Profit and Loss tick by tick as the market fluctuates.
MetaTrader 4 - Forex Trading Software
The MT4 Platform has a user-friendly front-end trading interface. It provides technical analysis, charting and Expert Advisors to help you develop your own trading strategies.
MT4 provides several different installations for your account management needs:
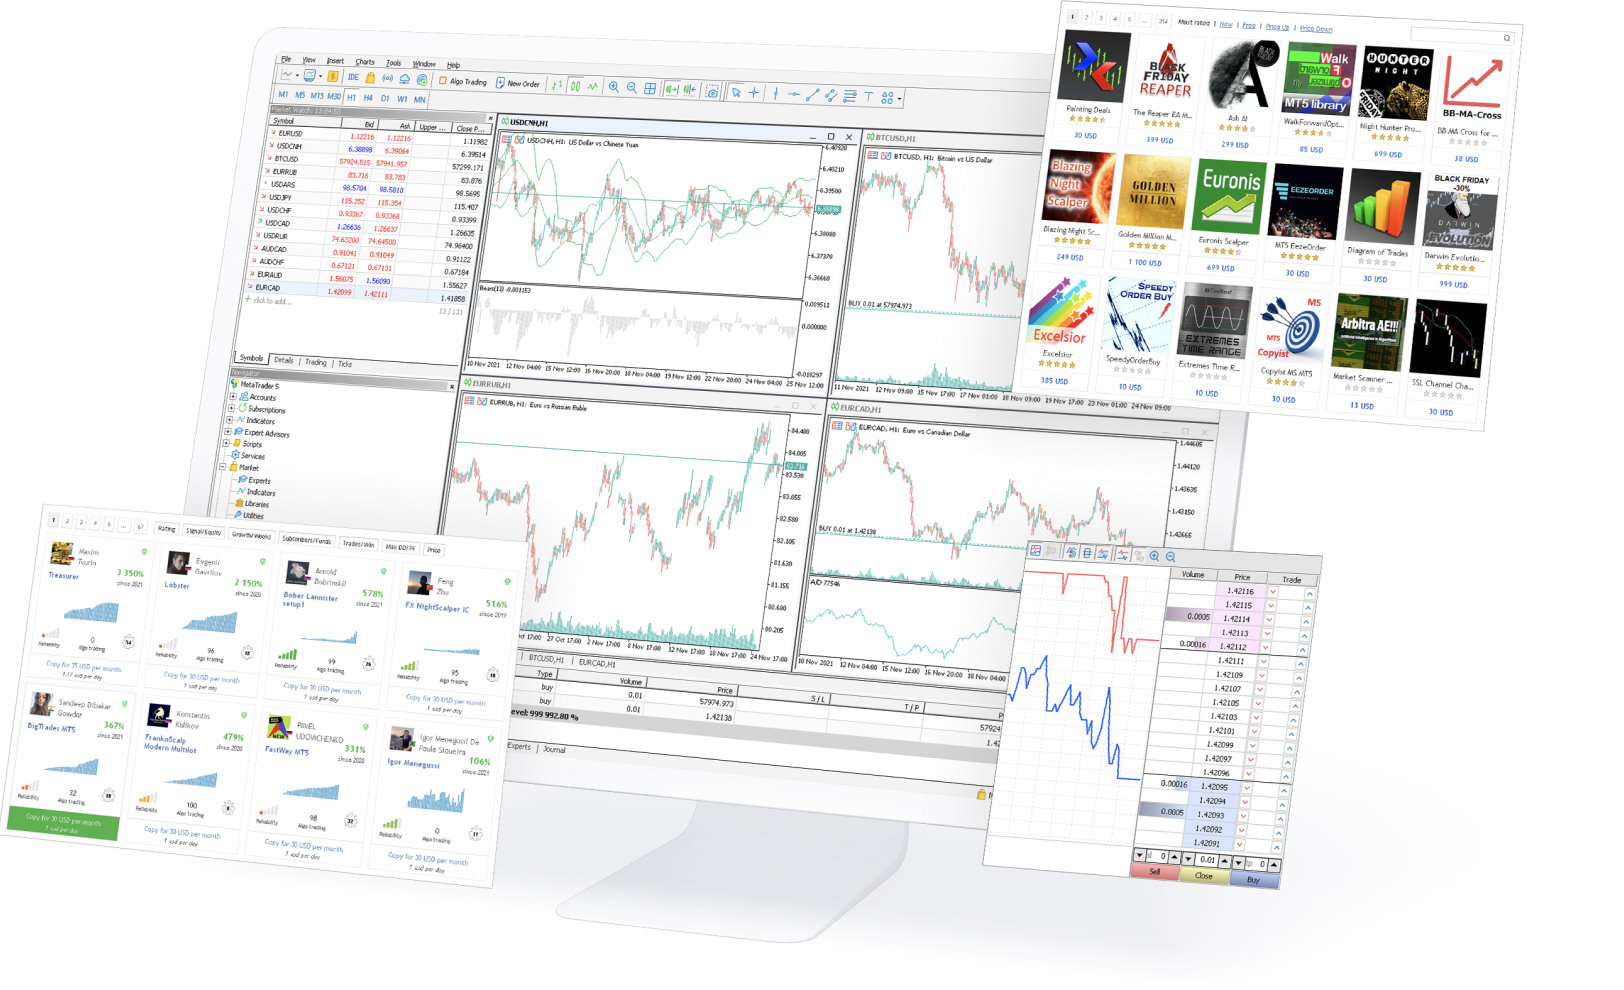
A
Accrual
The apportionment of premiums and discounts on forward exchange transactions that relate directly to deposit swap (Interest Arbitrage) deals, over the period of each deal.
Adjustment
Official action normally done by either change in the internal economic policies to correct a payment imbalance or in the official currency rate.
Appreciation
A currency is said to 'appreciate' when it strengthens in price in response to market demand.
Arbitrage
The purchase or sale of an instrument and the simultaneous taking of an equal and opposite position in a related market in order to take advantage of small price differentials between markets.
Ask (Offer) Price
The price at which the market is prepared to sell a specific Currency in a Foreign Exchange Contract or Cross Currency Contract. At this price, the trader can buy the base currency. In the quotation, it is shown on the right side of the quotation. For example, in the quote USD/CHF 1.4527/32, the ask price is 1.4532; meaning you can buy one US dollar for 1.4532 Swiss francs.
At Best
An instruction given to a dealer to buy or sell at the best rate that can be obtained.
At or Better
An order to deal at a specific rate or better.
B
Balance of Trade
The value of a country's exports minus its imports.
Bar Chart
A type of chart which consists of four significant points: the high and the low prices, which form the vertical bar; the opening price, which is marked with a little horizontal line to the left of the bar; and the closing price, which is marked with a little horizontal line of the right of the bar.
Base Currency
The first currency in a Currency Pair. It shows how much the base currency is worth as measured against the second currency. For example, if the USD/CHF rate equals 1.6215 then one USD is worth CHF 1.6215 In the FX markets, the US Dollar is normally considered the 'base' currency for quotes, meaning that quotes are expressed as a unit of $1USD per the other currency quoted in the pair. The primary exceptions to this rule are the British Pound, the European Euro and the Australian Dollar.
Bear Market
A market distinguished by declining prices.
Bid Price
The bid is the price at which the market is prepared to buy a specific Currency in a Foreign Exchange Contract or Cross Currency Contract. At this price, the trader can sell the base currency. It is shown on the left side of the quotation. For example, in the quote USD/CHF 1.4527/32, the bid price is 1.4527; meaning you can sell one US dollar for 1.4527 Swiss francs.
Bid/Ask Spread
The difference between the bid and offer price. Big Figure Quote - Dealer expression referring to the first few digits of an exchange rate. These digits are often omitted in dealer quotes. For example, a USD/JPY rate might be 117.30/117.35, but would be quoted verbally without the first three digits i.e., "30/35".
Book
In a professional trading environment, a 'book' is the summary of a trader's or desk's total positions.
Broker
An individual or firm that acts as an intermediary, putting buyers and sellers together for a fee or commission. In contrast, a 'dealer' commits capital and takes one side of a position, hoping to earn a spread(profit) by closing out the position in a subsequent trade with another party.
Bretton Woods Agreement of 1944
An agreement that established fixed foreign exchange rates for major currencies, provided for central bank intervention in the currency markets, and pegged the price of gold at US $35per ounce. The agreement lasted until 1971, when President Nixon overturned the Bretton Woods agreement and established a floating exchange rate for the major currencies.
Bull Market
A market distinguished by rising prices.
Bundesbank
Germany's Central Bank.
C
Cable
Trader jargon referring to the Sterling/US Dollar exchange rate. So-called because the rate was originally transmitted via a transatlantic cable beginning in the mid-1800's.
Candlestick Chart
A chart that indicates the trading range for the day as well as the opening and closing prices. If the open price is higher than the close price, the rectangle between the open and close prices is shaded. If the close price is higher than the open price, that area of the chart is not shaded.
Cash Market
The market in the actual financial instrument on which a futures or options contract is based.
Central Bank
A government or quasi-governmental organization that manages a country's monetary policy. For example, the US central bank is the Federal Reserve, and the German central bank is the Bundesbank.
Chartist
An individual who uses charts and graphs and interprets historical data to find trends and predict future movements. Also referred to as Technical Trader.
Cleared Funds
Funds that are freely available, sent in to settle a trade.
Closed Position
Exposures in Foreign Currencies that no longer exist. The process to close a position is to sell or buy a certain amount of currency to offset an equal amount of the open position. This will 'square' the position.
Clearing
The process of settling a trade.
Contagion
The tendency of an economic crisis to spread from one market to another. In 1997, political instability in Indonesia caused high volatility in their domestic currency, the Rupiah. From there, the contagion spread to other Asian emerging currencies, then to Latin America, and is now referred to as the 'Asian Contagion'.
Collateral
Something given to secure a loan or as a guarantee of performance.
Commission
A transaction fee charged by a broker.
Confirmation
A document exchanged by counterparts to a transaction that states the terms of said transaction.
Contract
The standard unit of trading.
Counter Currency
The second listed Currency in a Currency Pair.
Counterparty
One of the participants in a financial transaction.
Country Risk
Risk associated with a cross-border transaction, including but not limited to legal and political conditions.
Cross Currency Pairs or Cross Rate
A foreign exchange transaction in which one foreign currency is traded against a second foreign currency. For example: EUR/GBP
Currency symbols
A representation of the currency in its graphical form. For example:
AUD Australian Dollar
CAD Canadian Dollar
EUR Euro
JPY Japanese Yen
GBP British Pound
CHF Swiss Franc
Currency
Any form of money issued by a government or central bank and used as legal tender and a basis for trade.
Currency Pair
The two currencies that make up a foreign exchange rate. For Example: EUR/USD
Currency Risk
The probability of an adverse change in exchange rates.
D
Day Trader
Speculators who take positions in commodities that are liquidated prior to the close of the same trading day.
Dealer
An individual or firm that acts as a principal or counterpart to a transaction. Principals take one side of a position, hoping to earn a spread (profit) by closing out the position in a subsequent trade with another party. In contrast, a broker is an individual or firm that acts as an intermediary, putting together buyers and sellers for a fee or commission.
Deficit
A negative balance of trade or payments.
Delivery
An FX trade where both sides make and take actual delivery of the currencies traded.
Depreciation
A fall in the value of a currency due to market forces.
Derivative
A contract that changes in value in relation to the price movements of a related or underlying security, future, or other physical instrument. An Option is the most common derivative instrument.
Devaluation
The deliberate downward adjustment of a currency's price, normally by official announcement.
E
Economic Indicator
A government-issued statistic that indicates current economic growth and stability. Common indicators include employment rates, Gross Domestic Product (GDP), inflation, retail sales, etc.
End of Day Order (EOD)
An order to buy or sell at aspecified price. This order remains open until the end of the trading day, which is typically 5PM EST.
European Monetary Union (EMU)
The principal goal of the EMU is to establish a single European currency called the Euro, which officially replaced the national currencies of the EU member states in 2002. On January1, 1999 the transitional phase to introduce the Euro began. The Euro now exists as a banking currency, and paper financial transactions and foreign exchange are made in Euros. This transition period lasted for three years, at which time Euro notes and coins entered circulation. On July 1,2002, Euros became the legal tender for EMU participants, and the national currencies of the member countries ceased to exist. The current members of the EMU contain 27countries in Europe as of 2023.
EURO
The currency of the European Monetary Union (EMU). A replacement for the European Currency Unit (ECU).
European Central Bank (ECB)
The Central Bank for the European Monetary Union.
F
Federal Deposit Insurance Corporation (FDIC)
The regulatory agency responsible for administering bank depository insurance in the USA.
Federal Reserve (Fed)
The Central Bank of the United States.
First In First Out (FIFO)
Open positions are closed according to the FIFO accounting rule. All positions opened within a particular currency pair are liquidated in the order in which they were originally opened.
Flat/square
Dealer jargon used to describe a position that has been completely reversed, e.g., you bought $500,000 and then sold $500,000, thereby creating a neutral (flat) position.
Foreign Exchange (Forex, FX)
The simultaneous buying of onecurrency and selling of another.
Forward
The previously specified exchange rate for a foreign exchange contract settling at some agreed-upon future date based upon the interest rate differential between the two currencies involved.
Forward Points
The pips added to or subtracted from the current exchange rate to calculate a forward price.
Fundamental Analysis
Analysis of economic and political information with the objective of determining future movements in a financial market.
Futures Contract
An obligation to exchange a good or instrument at a set price on a future date. The primary difference between a Future and a Forward is that Futures are typically traded over an exchange (Exchange- Traded Contacts - ETC), versus forwards, which are considered Over the Counter (OTC) contracts. An OTC is any contract NOT traded on an exchange.
FX
Foreign Exchange.
G
G20
An intergovernmental forum comprising 19 countries and the European Union (EU). It works to address major issues related to the global economy, such as international financial stability, climate change mitigation and sustainable development. As of 2023, there are 20 members in the group: Argentina, Australia, Brazil, Canada, China, France, Germany, India, Indonesia, Italy, South Korea, Japan, Mexico, Russia, Saudi Arabia, South Africa, Turkey, the United Kingdom, the United States, and the European Union. Guest invitees include, among others, Spain, the United Nations, the World Bank, the African Union and ASEAN.
Going Long
The purchase of a stock, commodity, or currency for investment or speculation.
Going Short
The selling of a currency or instrument not owned by the seller.
Gross Domestic Product
Total value of a country's output, income or expenditure produced within the country's physical borders.
Gross National Product
Gross domestic product plus income earned from investment or work abroad.
Good 'Til Cancelled Order (GTC)
An order to buy or sell at a specified price. This order remains open until filled or until the client cancels.
H
Hedge
A position or combination of positions that reduces the risk of your primary position.
"Hit the bid"
Acceptance of purchasing at the offer or selling at the bid.
I
Inflation
An economic condition whereby prices for consumer goods rise, eroding purchasing power.
Initial Margin
The initial deposit of collateral required to enter into a position as a guarantee on future performance.
Interbank Rates
The Foreign Exchange rates at which large international banks quote other large international banks.
Intervention
Action by a central bank to affect the value of its currency by entering the market. Concerted intervention refers to action by a number of central banks to control exchange rates.
K
Kiwi
Slang for the New Zealand dollar.
L
Leading Indicators
Statistics that are considered to predict future economic activity.
Leverage
Also called margin. The ratio of the amount used in a transaction to the required security deposit.
Limit Order
An order with restrictions on the maximum price to be paid or the minimum price to be received. As an example, if the current price of USD/YEN is 117.00/05, then a limit order to buy USD would be at a price below 102. (i.e., 116.50)
Liquidation
The closing of an existing position through the execution of an offsetting transaction.
Liquidity
The ability of a market to accept large transactions with minimal to no impact on price stability.
Long Position
A position that appreciates in value if market prices increase. When the base currency in the pair is bought, the position is said to be long.
Lot
A unit to measure the amount of the deal. The value of the deal always corresponds to an integer number of lots.
M
Margin
The required equity that an investor must deposit to collateralize a position.
Margin Call
A request from a broker or dealer for additional funds or other collateral to guarantee performance on a position that has moved against the customer.
Market Maker
A dealer who regularly quotes both bid and ask prices and is ready to make a two-sided market for any financial instrument.
Market Risk
Exposure to changes in market prices.
Mark-to-Market
Process of re-evaluating all open positions with the current market prices. These new values then determine margin requirements.
Maturity
The date for settlement or expiration of a financial instrument.
N
Net Position
The amount of currency bought or sold that has not yet been offset by opposite transactions.
O
Offer (ask)
The rate at which a dealer is willing to sell a currency. See Ask (offer) price.
Offsetting transaction
A trade that serves to cancel or offset some or all of the market risk of an open position.
One Cancels the Other Order (OCO)
A designation for two orders whereby one part of the two orders is executed the other is automatically cancelled.
Open Order
An order that will be executedwhen the market movesto its designated price. Normally associated with Good 'til Cancelled Orders.
Open Position
An active trade with corresponding unrealized P&L that has not been offset by an equal and opposite deal.
Over the Counter (OTC)
Used to describe any transaction that is not conducted over an exchange.
Overnight Position
A trade that remains open until the next business day.
Order
An instruction to execute a trade at a specified rate.
P
Pips
The smallest unit of price for any foreign currency. Digits added to or subtracted from the fourth decimal place, i.e., 0.0001. Also called Points.
Political Risk
Exposure to changes in governmental policy that will have an adverse effect on an investor's position.
Position
The netted total holdings of a given currency.
Premium
In the currency markets, describes the amount by which the forward or futures price exceeds the spot price.
Price Transparency
Describes quotes to which every market participant has equal access.
Profit/Loss or "P/L" or Gain/Loss
The actual "realized" gain or loss resulting from trading activities on Closed Positions, plus the theoretical "unrealized" gain or loss on Open Positions that have been Mark-to-Market.
Q
Quote
An indicative market price, normally used for information purposes only.
R
Rally
A recovery in price after a period of decline.
Range
The difference between the highest and lowest price of a future recorded during a given trading session.
Rate
The price of one currency in terms of another; typically used for dealing purposes.
Resistance
A term used in technical analysis indicating a specific price level at which analysis concludes people will sell.
Revaluation
An increase in the exchange rate for a currency as a result of central bank intervention. Opposite of Devaluation.
Risk
Exposure to uncertain change, most often used with a negative connotation of adverse change.
Risk Management
The employment of financial analysis and trading techniques to reduce and/or control exposure to various types of risk.
Roll-Over
Process whereby the settlement of a deal is rolled forward to another value date. The cost of this process is based on the interest rate differential between the two currencies.
Round trip
Buying and selling of a specified amount of currency.
S
Settlement
The process by which a trade is entered into the books and records of the counterparties to a transaction. The settlement of currency trades may or may not involve the actual physical exchange of one currency for another.
Short Position
An investment position that benefits from a decline in market price. When the base currency in the pair is sold, the position is said to be short.
SOFR
The Secure Overnight Financing Rate. A benchmark interest rate for dollar-denominated derivatives and loans that has replaced the London Interbank Offered Rate (LIBOR)
Spot Price
The current market price. Settlement of spot transactions usually occurs within two business days.
Spread
The difference between the bid and offer prices.
Square
Purchase and sales are in balance and thus the dealer has no open position.
Sterling
Slang for British Pound.
Stop Loss
Order type whereby an open position is automatically liquidated at a specific price. Often used to minimize exposure to losses if the market moves against an investor's position. As an example, if an investor is long USD at 156.27, they might wish to put in a stoploss order for 155.49, which would limit losses should the dollar depreciate, possibly below 155.49.
Support Levels
A technique used in technical analysis that indicates a specific price ceiling and floor at which a given exchange rate will automatically correct itself. Opposite of resistance.
Swap
A currency swap is the simultaneous sale and purchase of the same amount of a given currency at a forward exchange rate.
Swissy
Market slang for Swiss Franc.
T
Technical Analysis
An effort to forecast prices by analyzing market data, i.e., historical price trends and averages, volumes, open interest, etc.
Tick
A minimum change in price, up or down.
Tomorrow Next (Tom/Next)
Simultaneous buying and selling of a currency for delivery the following day.
Transaction Cost
The cost of buying or selling a financial instrument.
Transaction Date
The date on which a trade occurs.
Turnover
The total money value of all executed transactions in a given time period.
Two-Way Price
When both a bid and offer rate are quoted for a FX transaction.
U
Unrealized Gain/Loss
The theoretical gain or loss on Open Positions valued at current market rates, as determined by the broker in its sole discretion. Unrealized Gains/Losses become Profits/Losses when position is closed.
Uptick
A new price quote at a price higher than the preceding quote.
Uptick Rule
In the U.S., a regulation whereby a security may not be sold short unless the last trade prior to the short sale was at a price lower than the price at which the short sale is executed.
US Prime Rate
The interest rate at which US banks will lend to their prime corporate customers.
V
Value Date
The date on which counterparts toa financial transaction agree to settle their respective obligations, i.e., exchanging payments. For spot currency transactions, the value date is normally two business days forward. Also known as maturity date.
Variation Margin
Funds a broker must request from the client to have the required margin deposited. The term usually refers to additional funds that must be deposited as a result of unfavorable price movements.
Volatility (Vol)
A statistical measure of a market's price movements over time.
W
Whipsaw
Slang for a condition of a highly volatile market where a sharp price movement is quickly followed by a sharp reversal.
Y
Yard
Slang for a billion.

Lorem ipsum dolor sit amet, consectetur adipiscing elit. Suspendisse varius enim in eros elementum tristique. Duis cursus, mi quis viverra ornare, eros dolor interdum nulla, ut commodo diam libero vitae erat. Aenean faucibus nibh et justo cursus id rutrum lorem imperdiet. Nunc ut sem vitae risus tristique posuere.